Visualize Beautiful Heatmaps Faster on Cesium
2024-07-08
Intro
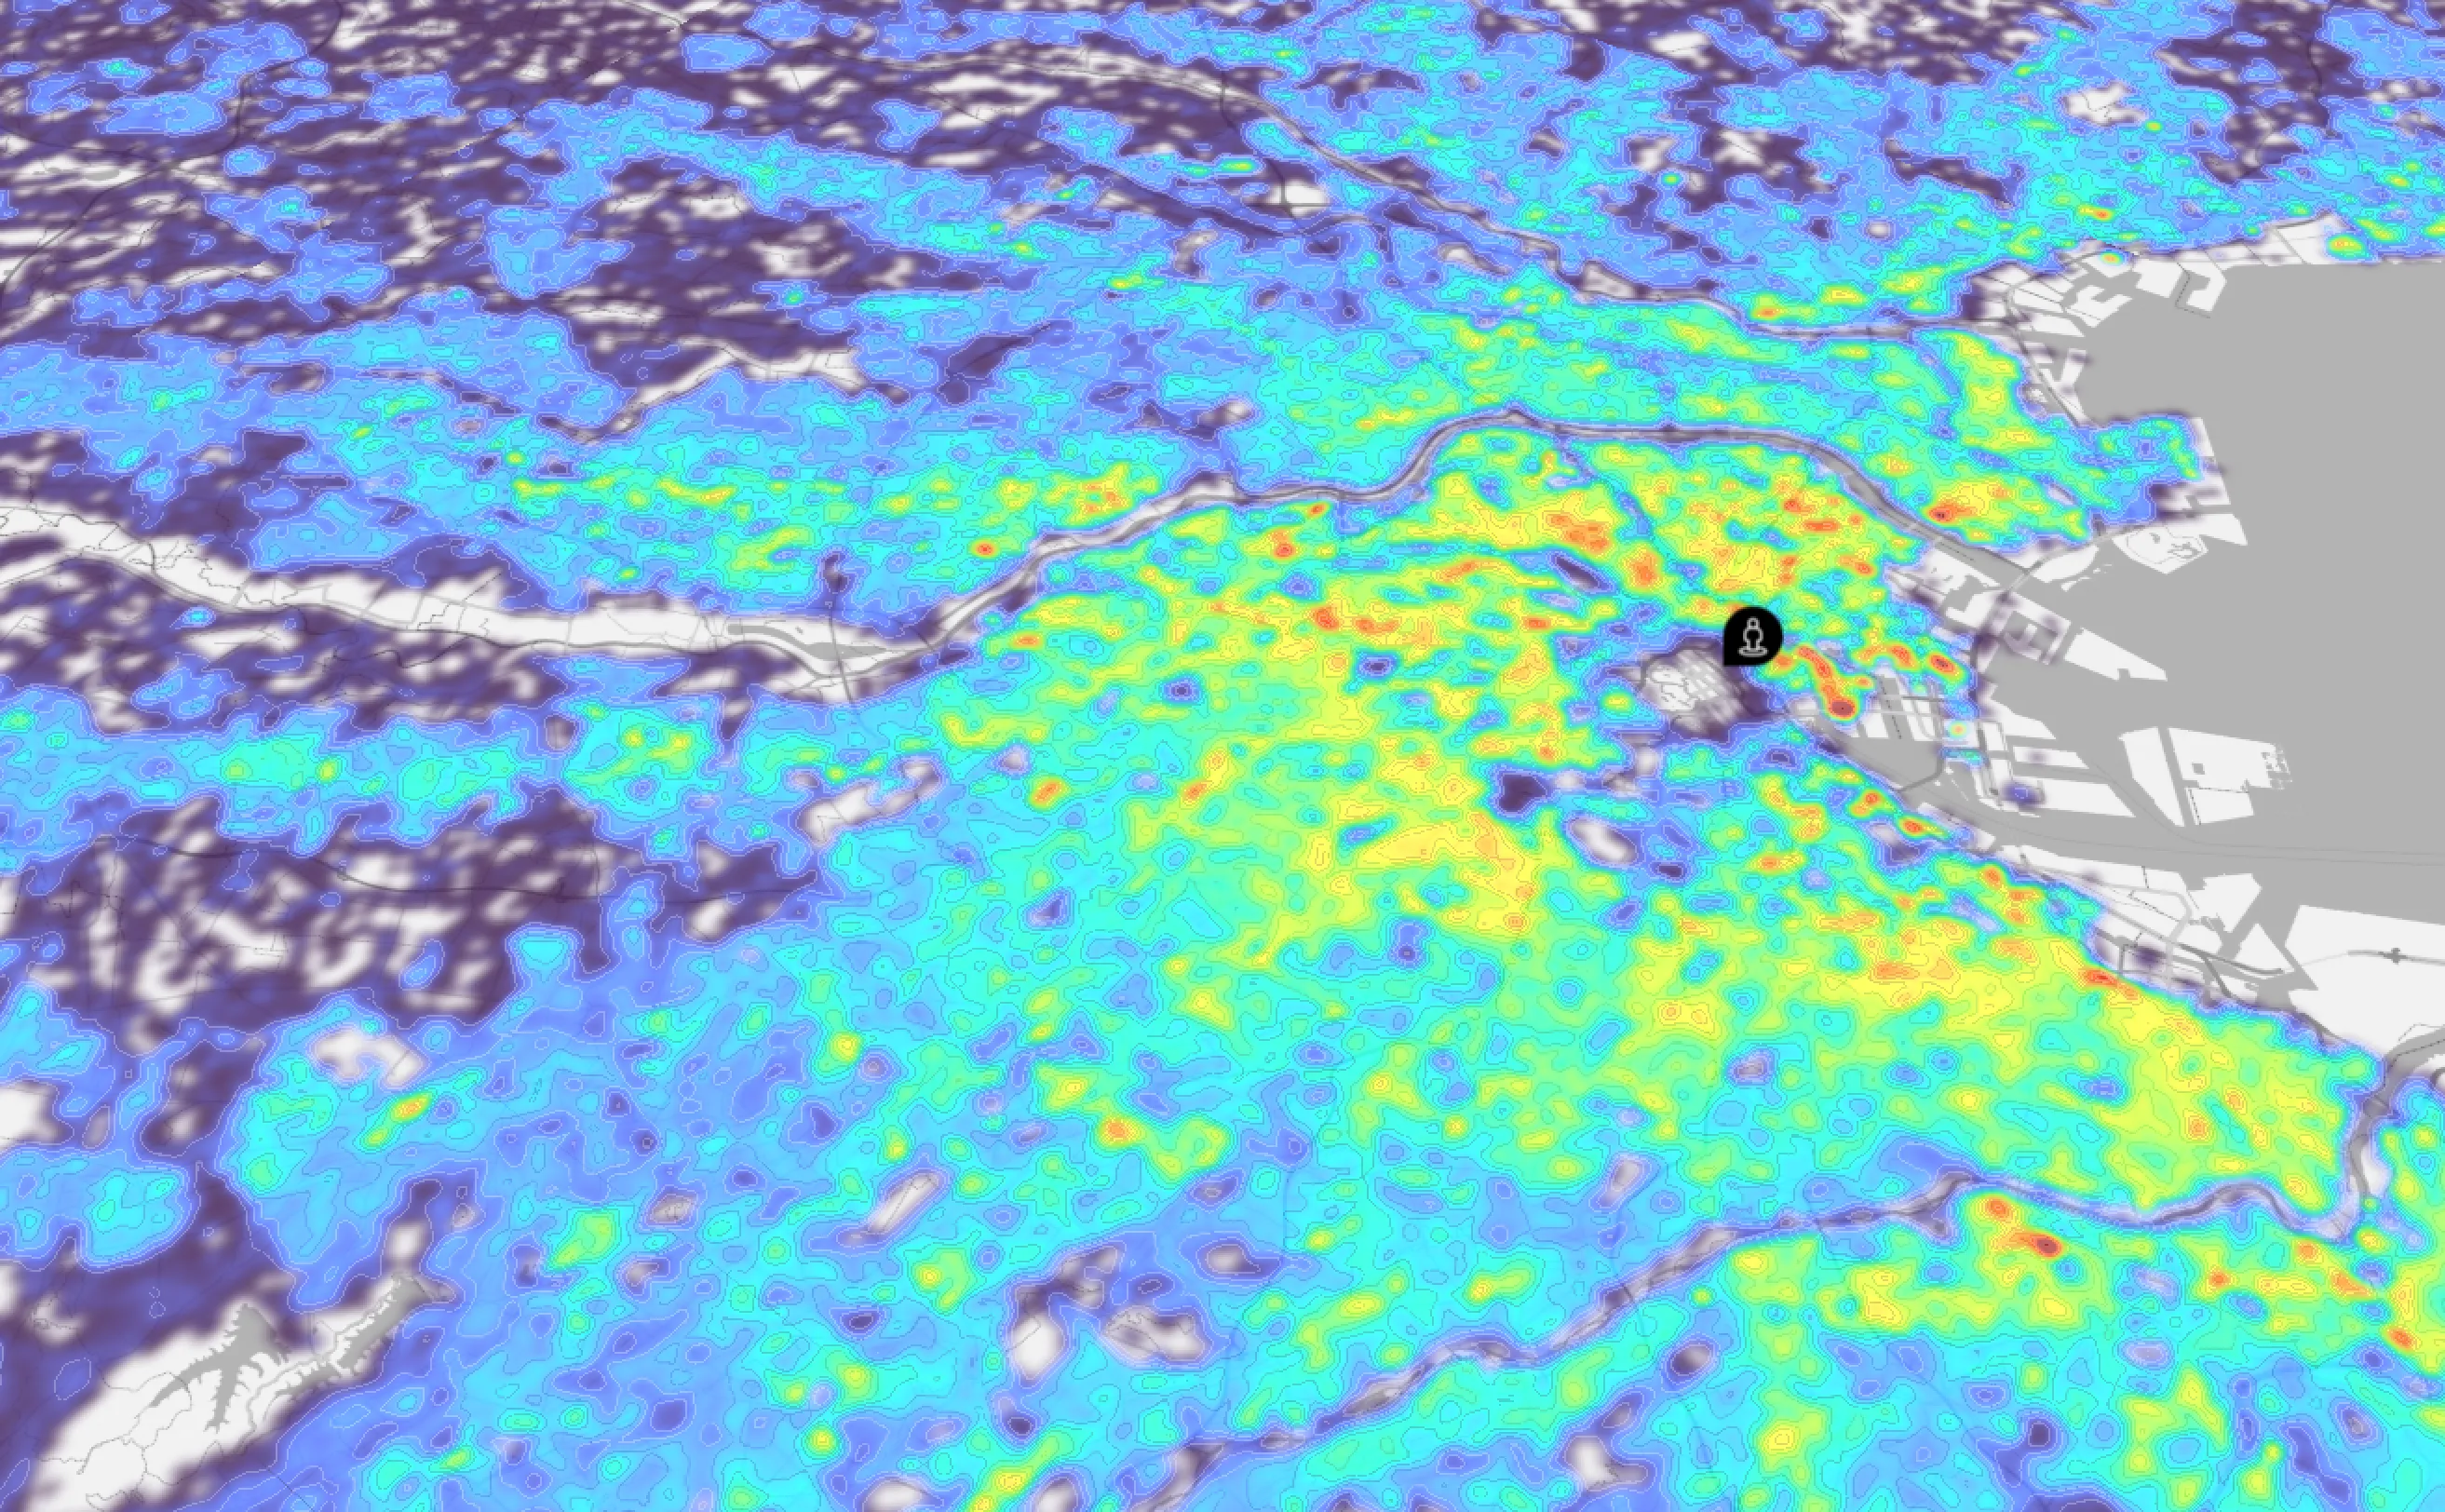
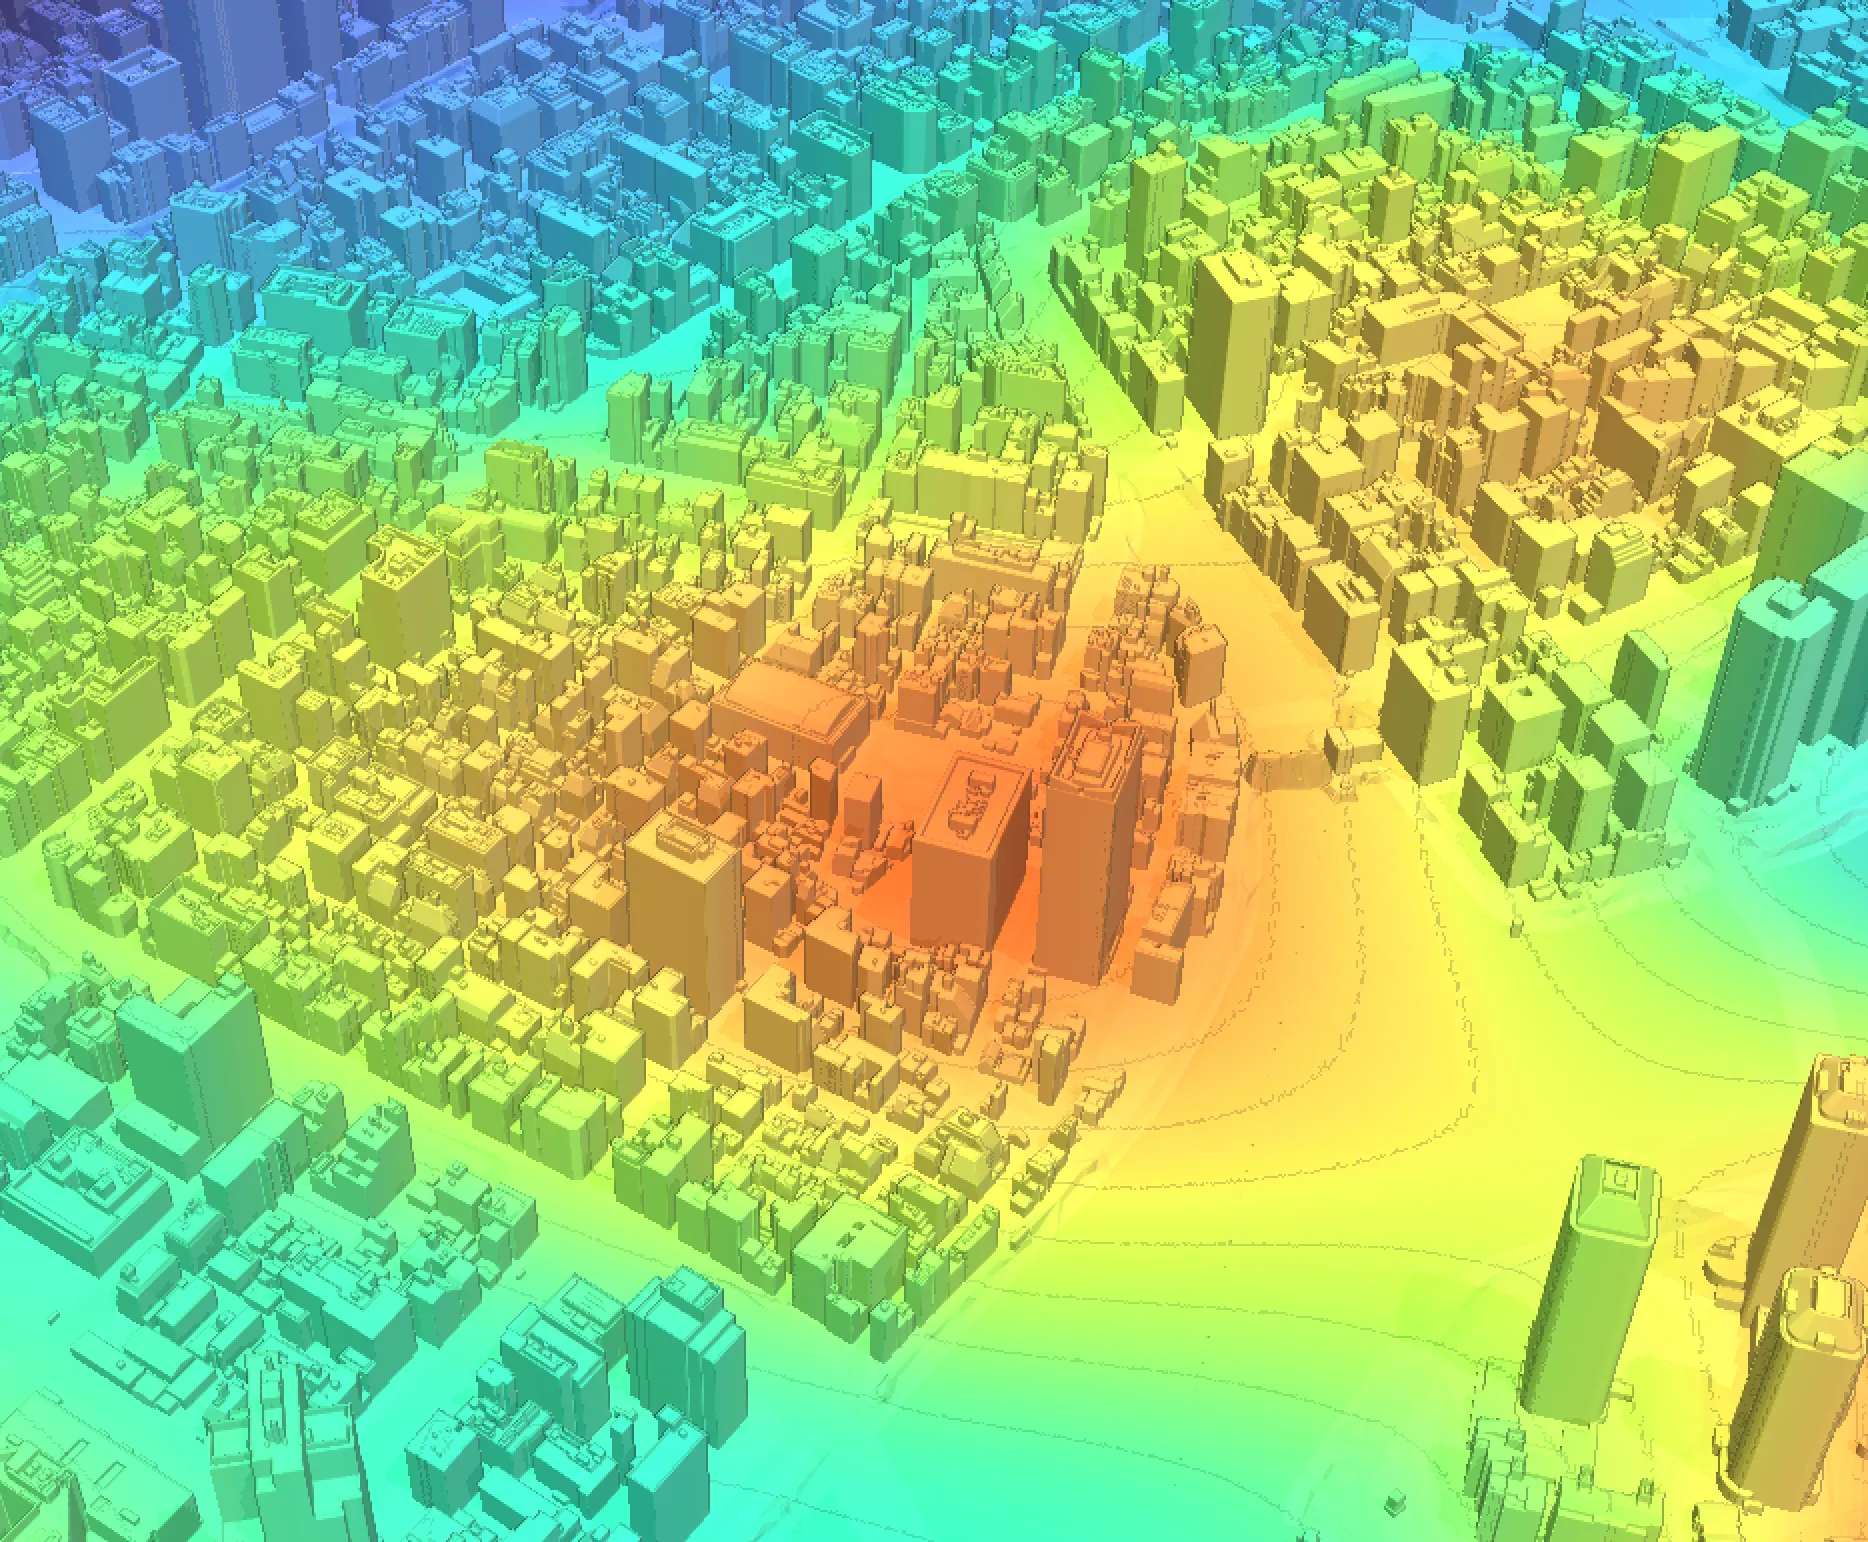
In this blog post, we'll explore how to visualize beautiful heatmaps faster on Cesium. To do it, we can customize Cesium's Ground Primitives, which allow unique appearances. So, we'll dive into the process of defining your own materials and shaders, allowing you to produce striking visual results like the one shown below.
By leveraging Cesium's flexibility, we can create custom visualizations that go beyond the standard offerings, opening up new possibilities for geospatial data representation. Whether you're looking to create heatmaps, custom terrain overlays, or other specialized visualizations, this technique will provide you with the tools to bring your ideas to life in Cesium.
What you see above is a heatmap showing the population density of Chiyoda City in Tokyo. This will be our focus today: creating a heatmap visualization in Cesium. While we'll concentrate on this specific example, it's worth noting that the approach we'll discuss can be applied to a variety of custom visualizations, such as rendering custom tiles or displaying other types of geospatial data.
By walking through the process of creating this heatmap, you'll gain insights into techniques that can be adapted for your own unique data visualization needs in Cesium.
Let's get started on this exciting journey of hacking Cesium's Ground Primitives!
Context
Before jumping to the implementation of material, We need to learn a bit of few things:
Scene
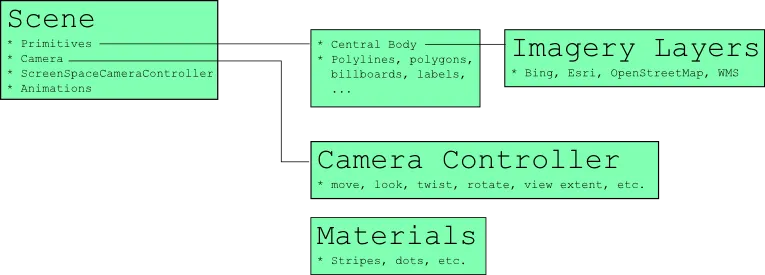
Scene The container for all 3D graphical objects and state in a Cesium virtual scene. The Scene is comprised of the couple of component that we need to understand to have a clear picture. Primitives , Camera , ScreenSpaceCameraController and Animations . To manipulate the apperance we need to interact with the Primitives which we’ll discuss in the next section
Primitives
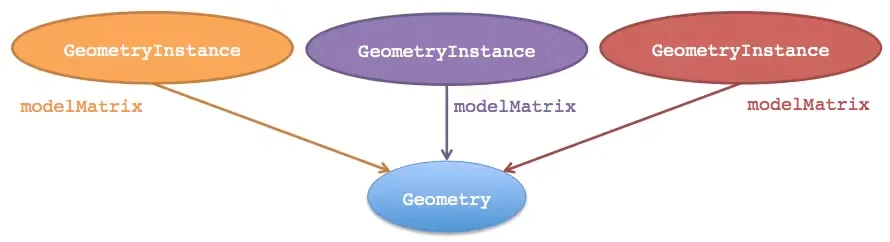
A primitive represents geometry in the Scene. It consists of two main components(Figure 3): geometry, which can come from a single GeometryInstance, and Appearance, which defines the primitive’s shading, determining how individual pixels are colored.
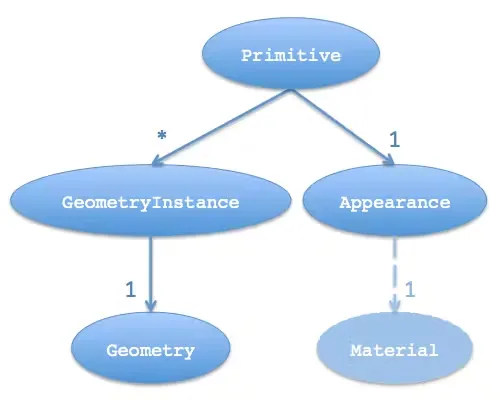
While a primitive can have many geometry instances(Figure 4), it can only have one appearance. Depending on the type of appearance, it will include a material that defines the majority of the shading.
Material
Cesium uses a system called Fabric to define materials. Fabric is a JSON schema that allows you to describe how a material should look and behave. For simple materials, you might just specify components like diffuse color or specular intensity. But for more complex materials, like our heatmap, we can provide a full GLSL shader implementation.
Steps to Generate a Heatmap
Now, to implement a heatmap as shown above, you'll need a few components. You'll either need:
- The consensus data for each region with appropriate numbers (value map), or
- A Mesh Image that represents the same information as the data
For the purpose of this blog, let's assume you're provided with a value map, To show a heatmap of an area, you'll need to follow these steps:
- Create a mesh image from the value map data
- Create a Cesium Material from the mesh image
- Attach the created Material to your Primitive
Let's examine each of these steps in detail.
Create a mesh image from a value map
While there’s no standard format to store mesh data, you can start if with something basic like:
type MeshData = {
  codes: Float64Array;
  values: Float32Array;
  scale?: number;
};
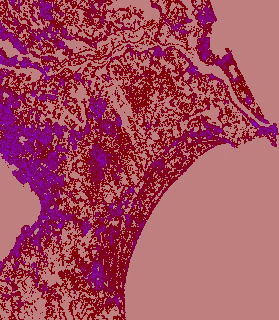
To create a mesh image from a give value map data, you can follow following steps:
- Prepare Input Data: Input data including geographical codes and values are provided.
- Convert Codes to Bounds: Convert each code to its corresponding geographical bounds.
- Determine Mesh Size: Calculate the size of the mesh based on the type.
- Initialize Image Data: Initialize a data array to store pixel values.
- Populate Image Data: Populate the data array with scaled values converted to color representations.
- Create Mesh Data: Return an object containing the processed image data and mesh dimensions.
- Create Canvas: Create a canvas element with the mesh dimensions.
- Create ImageData: Create an ImageData object from the mesh data.
- Draw Image Data: Draw the ImageData onto the canvas.
- Return Mesh Image Data: Return an object containing the canvas and other mesh properties.
And the end result can look something like the following:
type MeshImageData = {
  image: HTMLCanvasElement;
  width: number;
  height: number;
  maxValue?: number;
  minValue?: number;
};
With the above Structure of MeshImageData in mind, you can go about implementing it like the following
type GeoCode = string;
type Bounds = { west: number; south: number; east: number; north: number };
type ValueMap = Map<GeoCode, number>;

interface MeshImageData {
  image: HTMLCanvasElement;
  width: number;
  height: number;
  minValue: number;
  maxValue: number;
}

async function createMeshImageFromValueMap(valueMap: ValueMap): Promise<MeshImageData> {
  // Step 1: Prepare Input Data
  const codes = Array.from(valueMap.keys());
  const values = Array.from(valueMap.values());

  // Step 2: Convert Codes to Bounds
  const boundsList = await convertCodesToBounds(codes);

  // Step 3: Determine Mesh Size
  const { width, height } = calculateMeshSize(boundsList);

  // Step 4: Initialize Image Data
  const imageData = new Uint8ClampedArray(width * height * 4);

  // Step 5: Populate Image Data
  const { populatedImageData, minValue, maxValue } = populateImageData(imageData, width, height, boundsList, values);

  // Step 6: Create Mesh Data
  const meshData = {
    data: populatedImageData,
    width,
    height,
    minValue,
    maxValue
  };

  // Step 7: Create Canvas
  const canvas = document.createElement('canvas');
  canvas.width = width;
  canvas.height = height;

  // Step 8: Create ImageData
  const ctx = canvas.getContext('2d')!;
  const cesiumImageData = new ImageData(meshData.data, width, height);

  // Step 9: Draw Image Data
  ctx.putImageData(cesiumImageData, 0, 0);

  // Step 10: Return Mesh Image Data
  return {
    image: canvas,
    width,
    height,
    minValue,
    maxValue
  };
}

// Helper functions

async function convertCodesToBounds(codes: GeoCode[]): Promise<Bounds[]> {
  // Implementation depends on your geocoding service
  // This is a placeholder
  return codes.map(code => ({ west: 0, south: 0, east: 1, north: 1 }));
}

function calculateMeshSize(boundsList: Bounds[]): { width: number; height: number } {
  // Implementation depends on your requirements
  // This is a placeholder
  return { width: 1000, height: 1000 };
}

function populateImageData(
  imageData: Uint8ClampedArray,
  width: number,
  height: number,
  boundsList: Bounds[],
  values: number[]
): { populatedImageData: Uint8ClampedArray; minValue: number; maxValue: number } {
  let minValue = Math.min(...values);
  let maxValue = Math.max(...values);

  for (let i = 0; i < boundsList.length; i++) {
    const bounds = boundsList[i];
    const value = values[i];
    const normalizedValue = (value - minValue) / (maxValue - minValue);

    // Calculate pixel range for this bound
    const startX = Math.floor(bounds.west * width);
    const startY = Math.floor(bounds.south * height);
    const endX = Math.ceil(bounds.east * width);
    const endY = Math.ceil(bounds.north * height);

    for (let y = startY; y < endY; y++) {
      for (let x = startX; x < endX; x++) {
        const index = (y * width + x) * 4;
        const color = getColorForValue(normalizedValue);
        imageData[index] = color[0];     // Red
        imageData[index + 1] = color[1]; // Green
        imageData[index + 2] = color[2]; // Blue
        imageData[index + 3] = 255;      // Alpha
      }
    }
  }

  return { populatedImageData: imageData, minValue, maxValue };
}

function getColorForValue(value: number): [number, number, number] {
  // This is a simple blue-to-red gradient
  // You can replace this with more sophisticated color mapping
  return [
    Math.floor(value * 255),
    0,
    Math.floor((1 - value) * 255)
  ];
}

// Usage
const valueMap = new Map<GeoCode, number>([
  ['A1', 10],
  ['B2', 20],
  ['C3', 30],
  // ... more data
]);

createMeshImageFromValueMap(valueMap).then(meshImageData => {
  console.log('Mesh Image Data created:', meshImageData);
  // Use meshImageData in your Cesium material
});
Cesium Material from a mesh image
Once you’ve prepared a mesh image then Its time to get to the fun stuff, which is creation of Materials.
The heatmap mesh Material
Our heatmap material will take an image containing our data, apply color mapping, and even add contour lines. Here's how we'll structure it:
- Define the uniforms: These are the inputs to our shader that we can control from JavaScript.
- Implement the material function: This is where the magic happens – we'll sample our data, apply color mapping, and create the final material.
- Create the Fabric definition: This wraps up our shader code and uniforms into a format Cesium understands.
Let's break it down step by step.
Step 1: The GLSL Shader
First, let's look at the core of our custom material – the GLSL shader code
uniform sampler2D colorMap;
uniform sampler2D image;
uniform vec2 imageScale;
uniform vec2 imageOffset;
uniform float width;
uniform float height;
uniform float opacity;
uniform float contourSpacing;
uniform float contourThickness;
uniform float contourAlpha;
uniform bool logarithmic;

// Helper function for logarithmic scaling
float pseudoLog(float value) {
  // ... implementation
}

czm_material czm_getMaterial(czm_materialInput materialInput) {
  // Sample the image data
  vec2 texCoord = materialInput.st * imageScale + imageOffset;
  vec2 pair = sampleBicubic(image, texCoord, vec2(width, height), 1.0 / vec2(width, height));
  float value = pair.x;
  float alpha = pair.y;

  // Apply logarithmic scaling if needed
  float scaledValue = logarithmic ? pseudoLog(value) : value;

  // Normalize the value and look up the color
  float normalizedValue = (scaledValue - minValue) / (maxValue - minValue);
  vec3 color = texture(colorMap, vec2(normalizedValue, 0.5)).rgb;

  // Apply contour lines
  float contour = makeContour(value - minValue, contourSpacing, contourThickness);
  color = mix(color, vec3(step(dot(color, vec3(0.299, 0.587, 0.114)), 0.5)), contour * contourAlpha);

  // Create the final material
  czm_material material = czm_getDefaultMaterial(materialInput);
  material.diffuse = color;
  material.alpha = opacity * alpha;
  return material;
}
This shader does several things:
- Samples our data image using bicubic interpolation for smoother results
- Applies optional logarithmic scaling
- Maps the data value to a color using a provided color map
- Adds contour lines for better data visualization
- Sets the final color and opacity of the material
Step 2: Creating the Fabric Definition
Now that we have our shader, we need to wrap it in a Fabric definition:
const heatmapMeshMaterial = new Cesium.Material({
  fabric: {
    type: 'HeatmapMesh',
    uniforms: {
      colorMap: colorMap, // https://github.com/matplotlib/matplotlib/blob/main/lib/matplotlib/_cm_listed.py
      image: heatmapImageData, // This was created in previous section
      imageScale: new Cesium.Cartesian2(1, 1),
      imageOffset: new Cesium.Cartesian2(0, 0),
      width: heatmapImageWidth,
      height: heatmapImageHeight,
      opacity: 1.0,
      contourSpacing: 10,
      contourThickness: 1,
      contourAlpha: 0.2,
      logarithmic: false
    },
    source: heatmapMeshMaterialShaderSource// This is the GLSL code we wrote above
  }
});
This Fabric definition tells Cesium about our custom material. It specifies the uniforms we'll use to control the material from JavaScript and includes our full GLSL shader source.
Attach the created Material to your Primitive
Now, we arrive at the crucial stage where all the pieces we've explored — custom Fabric materials, GLSL shaders, and Cesium's primitive system — come together to create a powerful, interactive heatmap visualization that seamlessly integrates with Cesium's 3D terrain.
General Implementation Flow
- Create a custom Material Define a shader that interprets your data and creates the desired visual effect.
- Define the Geometry
Create a
GeometryInstancethat outlines where your heatmap will be displayed on the globe. - Create and add a GroundPrimitive
Combine your custom material and geometry into a
GroundPrimitiveand add it to the scene. - Handle updates Set up a system to update material uniforms when your data changes.
- Manage lifecycle Properly add and remove primitives from the scene to prevent memory leaks.
Example Conceptual Flow
// 1. Create custom material
const heatmapMaterial = new Cesium.Material({
  fabric: {
    // Define your custom shader here
  }
});

// 2. Define geometry
const heatmapGeometry = new Cesium.GeometryInstance({
  geometry: new Cesium.PolygonGeometry({
    // Define your heatmap area here
  })
});

// 3. Create and add ground primitive
const heatmapPrimitive = new Cesium.GroundPrimitive({
  geometryInstances: heatmapGeometry,
  appearance: new Cesium.EllipsoidSurfaceAppearance({
    material: heatmapMaterial
  })
});
scene.groundPrimitives.add(heatmapPrimitive);

// 4. Handle updates
function updateHeatmap(newData) {
  heatmapMaterial.uniforms.dataTexture = newData;
  // Update other uniforms as needed
}

// 5. Manage lifecycle
function cleanup() {
  scene.groundPrimitives.remove(heatmapPrimitive);
}
This approach provides a flexible framework for creating dynamic, terrain-conforming heatmaps in Cesium. By separating the material definition, geometry creation, and update logic, you create a system that can be easily adapted to different datasets and visualization needs.
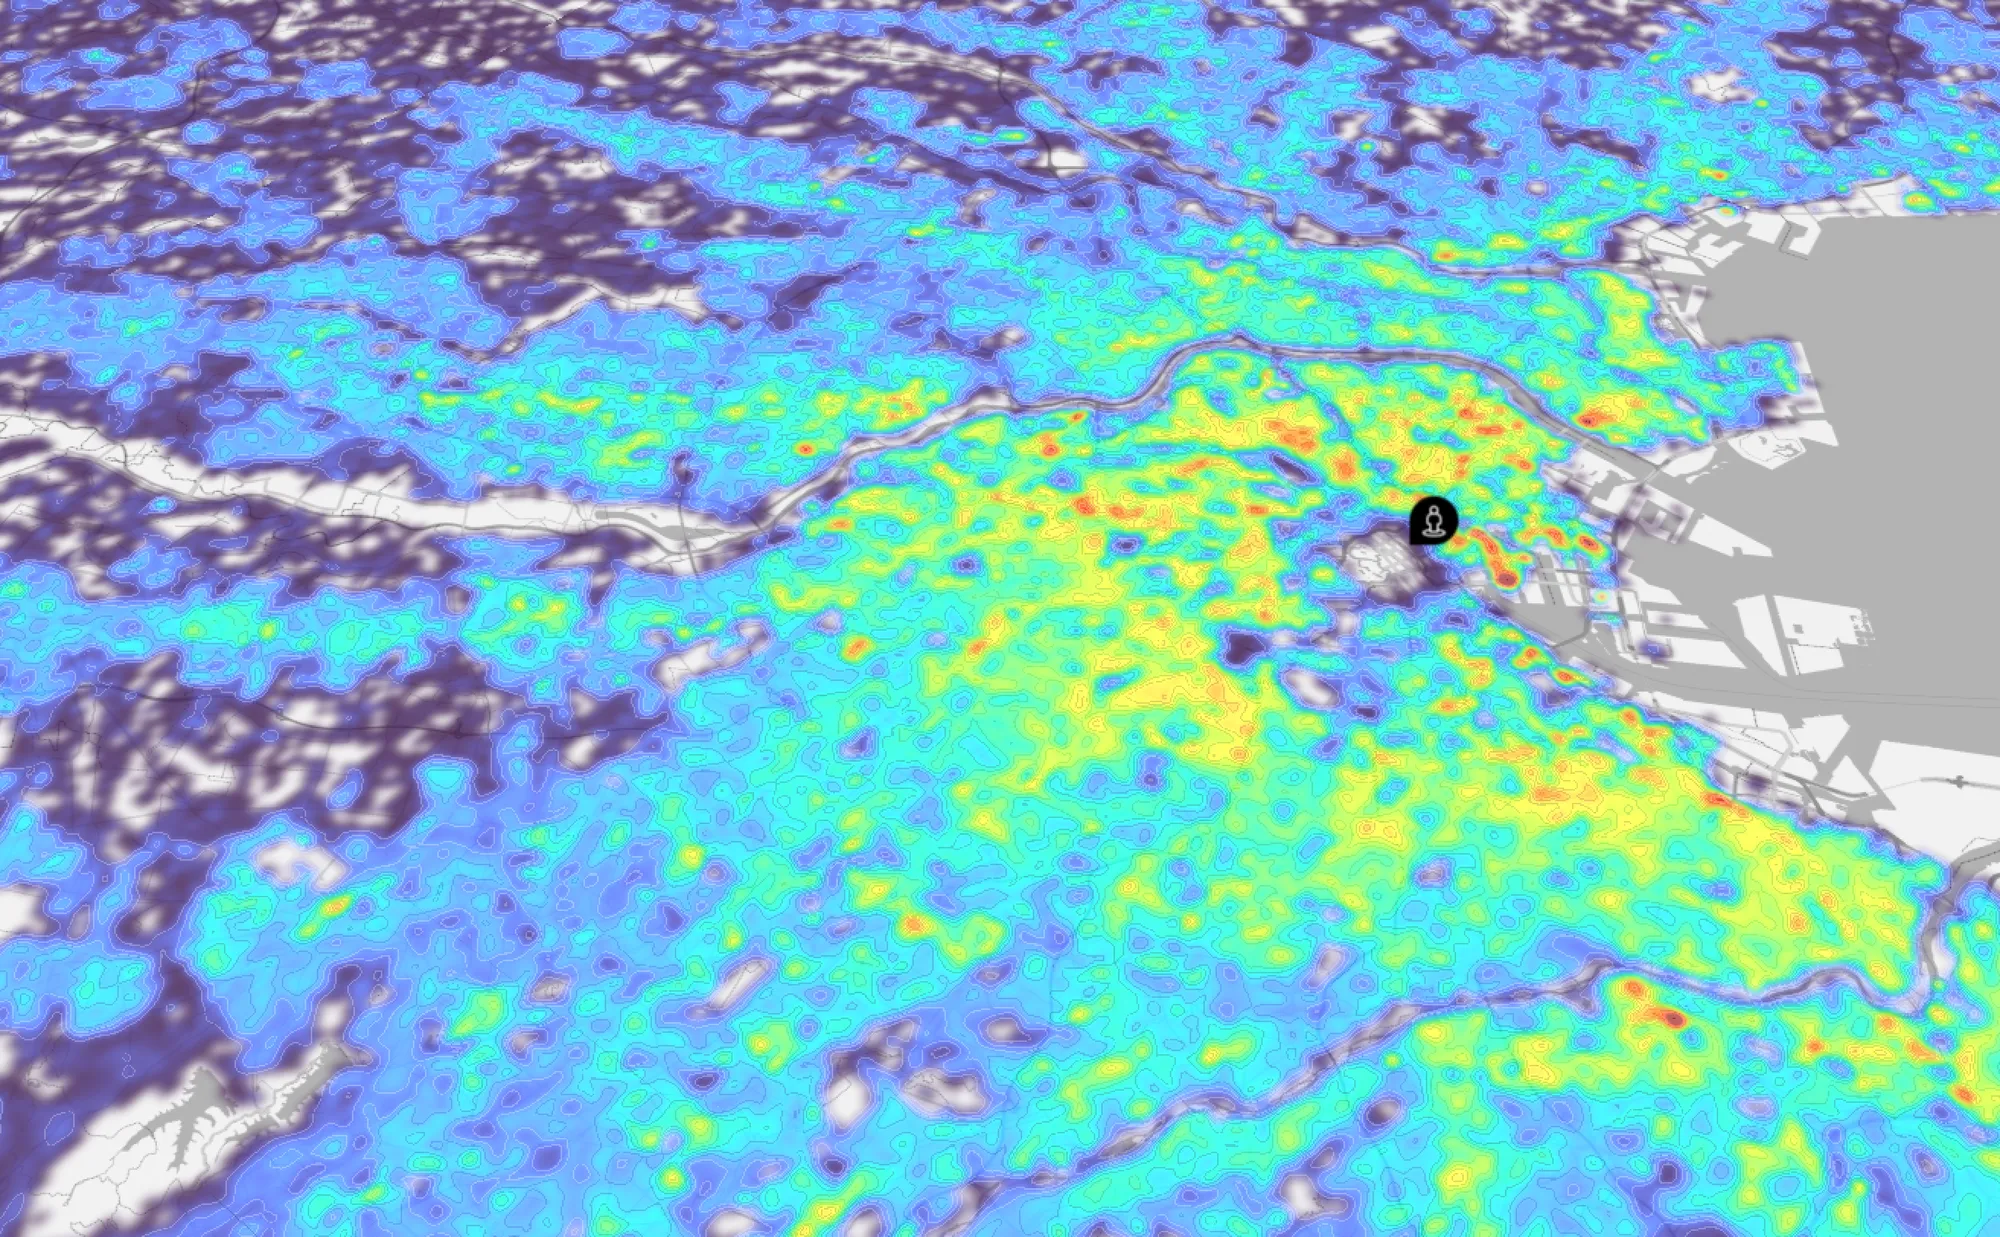
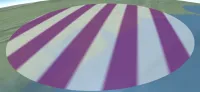
These implementation results in such appearance:
Conclusion
In this post, to visualize beautiful heatmaps faster on Cesium, we've explored the process of creating custom visualizations in Cesium, focusing on a terrain-conforming heatmap. Key takeaways include:
- Understanding Cesium's scene and primitive systems
- Creating custom materials with Fabric and GLSL
- Transforming raw data into compelling visual representations
This flexible approach extends far beyond population density heatmaps. It's a powerful tool for visualizing various geospatial datasets, limited only by your imagination and data availability.
As you apply these techniques, remember:
- Balance visual impact with performance
- Test across different devices and data complexities
You're now equipped to push the boundaries of geospatial visualization in Cesium. Whether you're mapping environmental data, economic indicators, or any other spatial information, these skills will serve you well.
Happy mapping!
References
Eukaryaでは様々な職種で採用を行っています!OSSにコントリビュートしていただける皆様からの応募をお待ちしております!
Eukarya is hiring for various positions! We are looking forward to your application from everyone who can contribute to OSS!
Eukaryaは、Re:Earthと呼ばれるWebGISのSaaSの開発運営・研究開発を行っています。Web上で3Dを含むGIS(地図アプリの公開、データ管理、データ変換等)に関するあらゆる業務を完結できることを目指しています。ソースコードはほとんどOSSとしてGitHubで公開されています。
➔ Re:Earth / ➔ Eukarya / ➔ note / ➔ GitHub
Eukarya is developing and operating a WebGIS SaaS called Re:Earth. We aim to complete all GIS-related tasks including 3D (such as publishing map applications, data management, and data conversion) on the web. Most of the source code is published on GitHub as OSS.