What is RTIN, which builds hierarchical LOD in real time?
2024-11-20
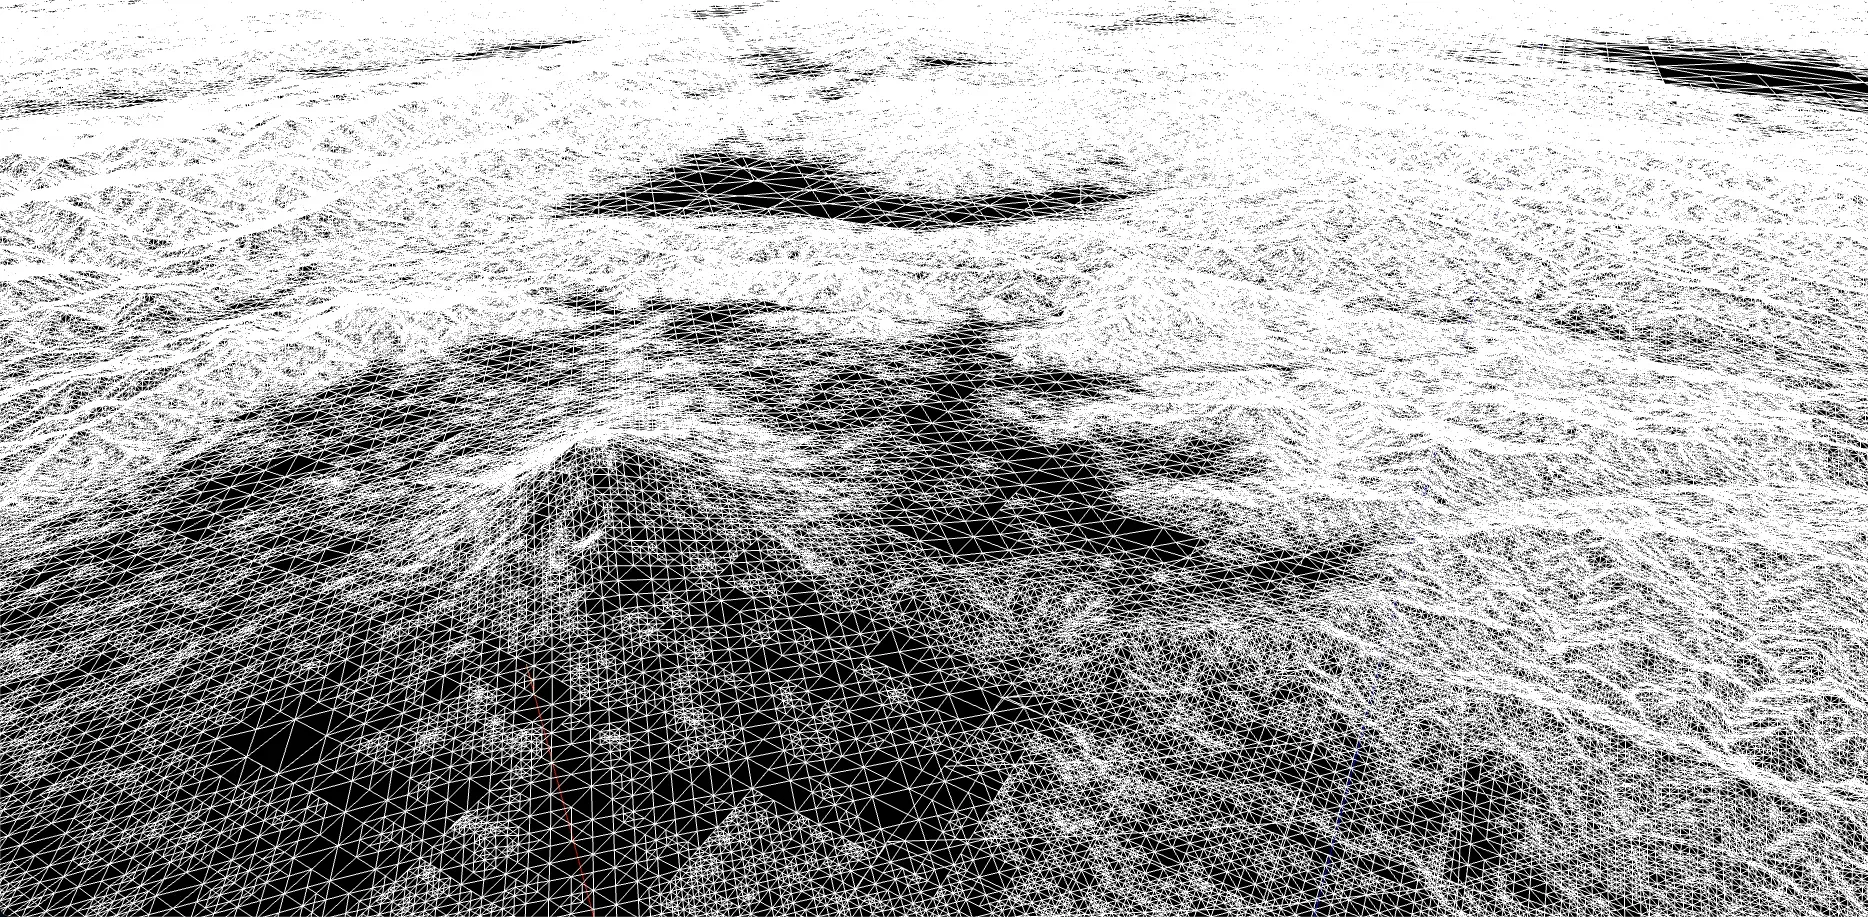
Hello, I’m Sasaki from Eukarya.
Our company is developing a new 3D map engine. A map engine displays a 3D globe, like Google Earth, where zooming in reveals more detailed images. Besides map applications like Google Earth, this engine can also be used for visualizing geospatial data. Examples of existing map engines include CesiumJS and Mapbox GL JS.
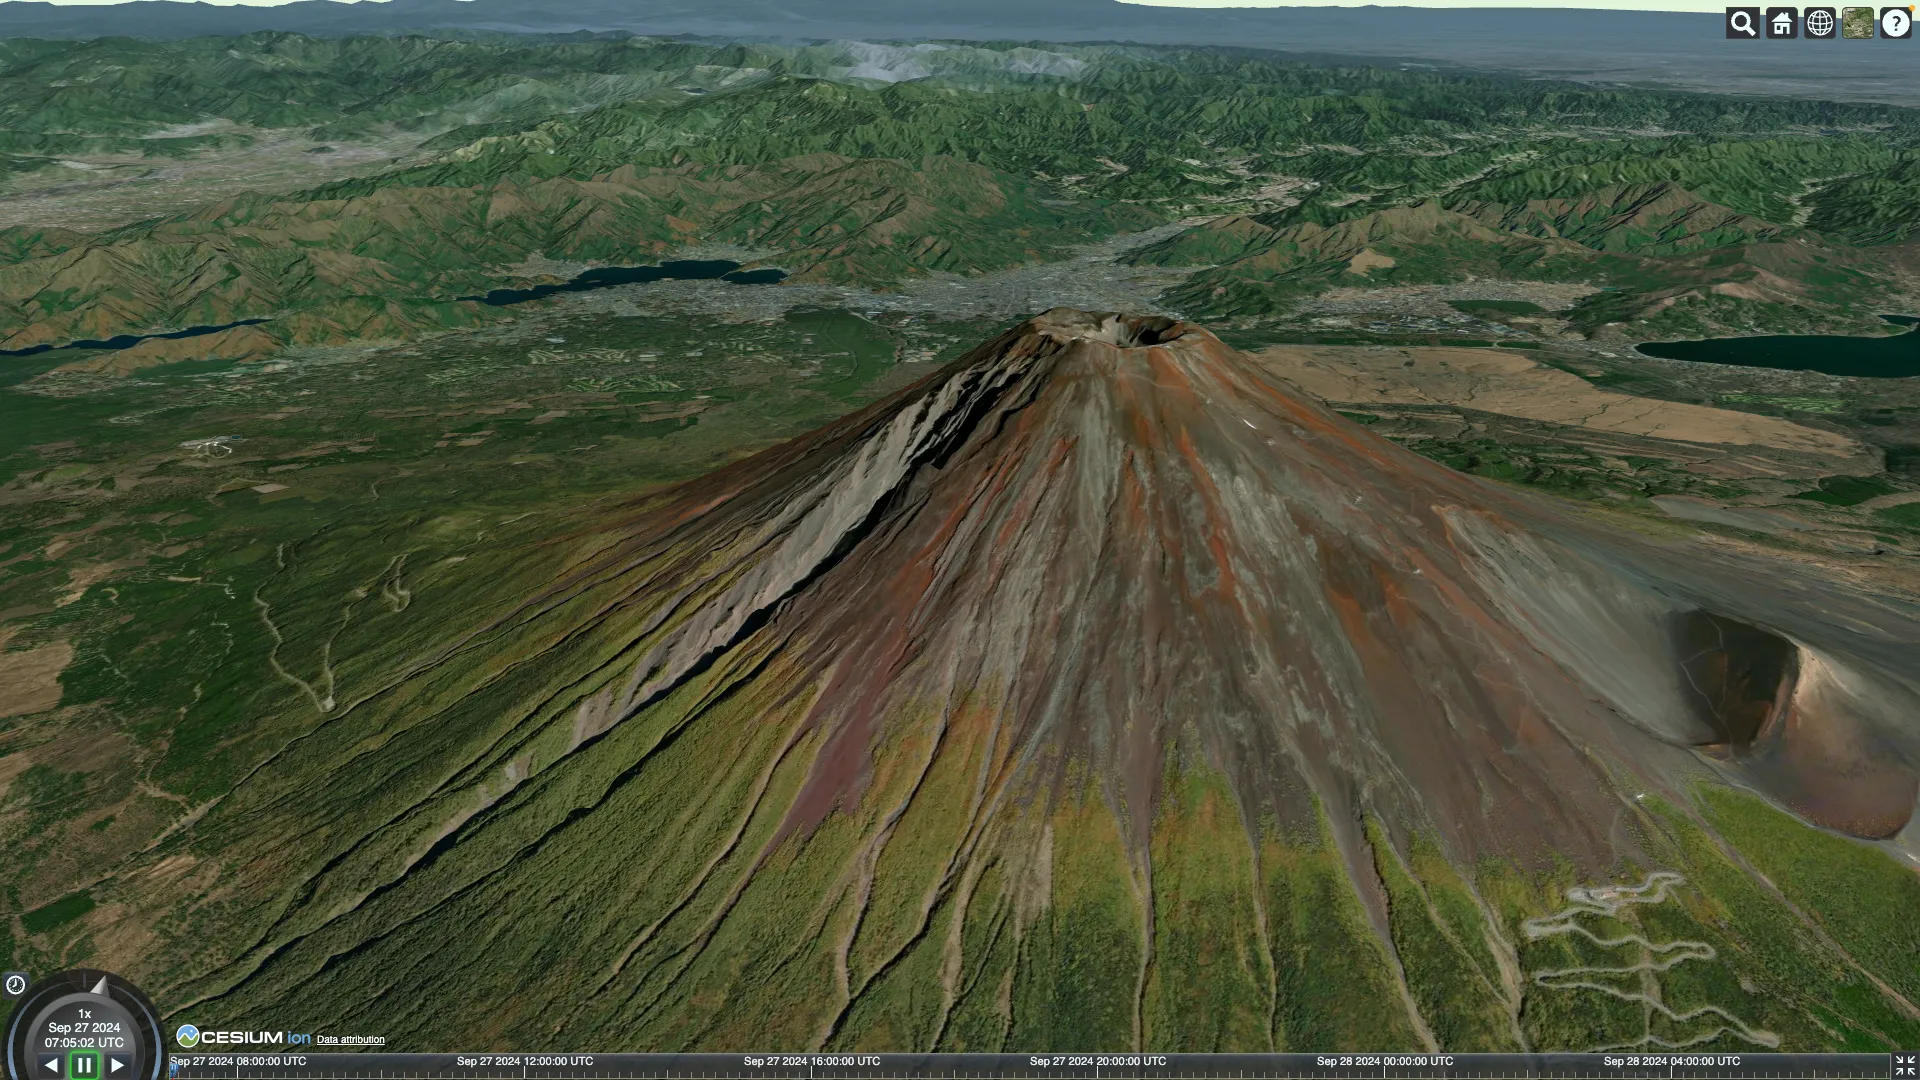
Map engines can display terrain, enabling more realistic visualizations that closely reflect the real world.
However, in a map engine rendering global-scale scenes, rendering all complex terrain details can place a heavy load on memory and CPU/GPU processing.
To address this issue, we’ve implemented an algorithm that dynamically applies LOD processing, adjusting detail levels based on the distance to the model.
What is LOD?
In computer graphics, displaying complex 3D models generally consumes a lot of memory and takes time to render.
To avoid these issues, LOD (Level of Detail) techniques simplify models in situations where details are unnecessary, such as distant or fast-moving models.
For more information, please refer to "LOD Algorithms in 3DCG."
How the Globe is Rendered
For further details, see "Optimizing Tile Rendering on the Earth Ellipsoid with Culling and SSE." Here’s an overview:
To correctly map images onto an Earth ellipsoid, we use raster tile data. This data is divided into tiles of a fixed size, structured by Z/X/Y coordinates.
This allows us to retrieve images at resolutions matching the camera’s zoom level.
For example, when the camera is far from the Earth ellipsoid, setting a smaller Z value retrieves a broader image, while a larger Z value yields more detail when the camera is closer.
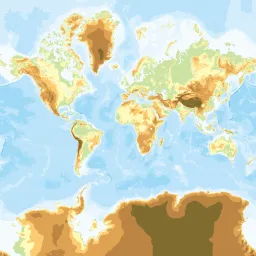
When Z is 0, we get an overall image like this:
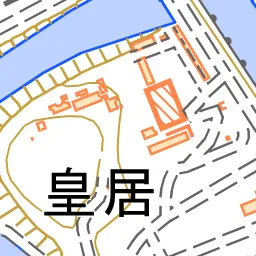
When Z is 17, a detailed image is returned:
The correct tile to render is determined by calculating the appropriate distance between the camera and the Earth ellipsoid.
Types of Terrain Data
There are two main data types for rendering terrain:
- Raster data
- Vector data
Both types can be requested in the Z/X/Y format, similar to tiles.
Raster Data
Examples of raster data include elevation tiles from the Geospatial Information Authority of Japan and Mapbox’s Terrain RGB v1.
Elevation tile data is represented in images with specific colors. These images are in PNG format, where elevation is encoded in each 8-bit RGB value.
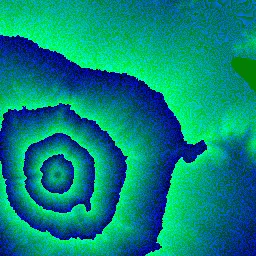
The terrain model is built from images containing elevation data. Details on this process are explained below.
Vector Data
For vector data, Cesium’s Quantized-mesh is available. Quantized-mesh data can also be requested in Z/X/Y format. This data includes pre-calculated vertices, indices, normals, and other necessary information for terrain rendering.
Raster data requires calculations to extract elevation and create the terrain mesh, while Quantized-mesh is pre-calculated, allowing for fast real-time rendering without complex calculations.
How to Build Terrain Models from Raster Data
To build a terrain model from raster data, we first extract elevation values from images containing elevation data.
For Elevation Tiles from GSI
For GSI elevation tiles in PNG format, elevation x (m) is calculated based on the specifications as follows:
x = 216R + 28G + B
If x < 223: h = xu
If x = 223: h = NA
If x > 223: h = (x-224)u

Elevation resolution: u = 0.01
Invalid value (NA): (R, G, B) = (128, 0, 0)
Once the elevation h is obtained, each tile vertex is scaled according to h.
For Mapbox Terrain-RGB v1
Note that the calculation method differs for Mapbox’s Terrain RGB v1. Based on specifications, it is calculated as follows:
height = -10000 + ((R * 256 * 256 + G * 256 + B) * 0.1)
Resolution is 0.1 m (lower than GSI’s elevation tiles).
Generating the Terrain Mesh
To align tile vertices with elevation values, the tile must be divided at an appropriate granularity.
Dividing a tile to match elevation tile pixel count results in uniform tile granularity.
Finally, each tile vertex is scaled according to the UV of the elevation tile from which elevation is extracted.
However, simple tile division results in uniform granularity, increasing the total vertex count in complex terrain and leaving unnecessary vertices in flat terrain.
To address this, RTIN (Right-Triangulated Irregular Networks) reduces vertex count in flat terrain while increasing it in complex areas, creating a smooth visual.
What is Right-Triangulated Irregular Networks (RTIN)?
This algorithm is used to efficiently render terrain.
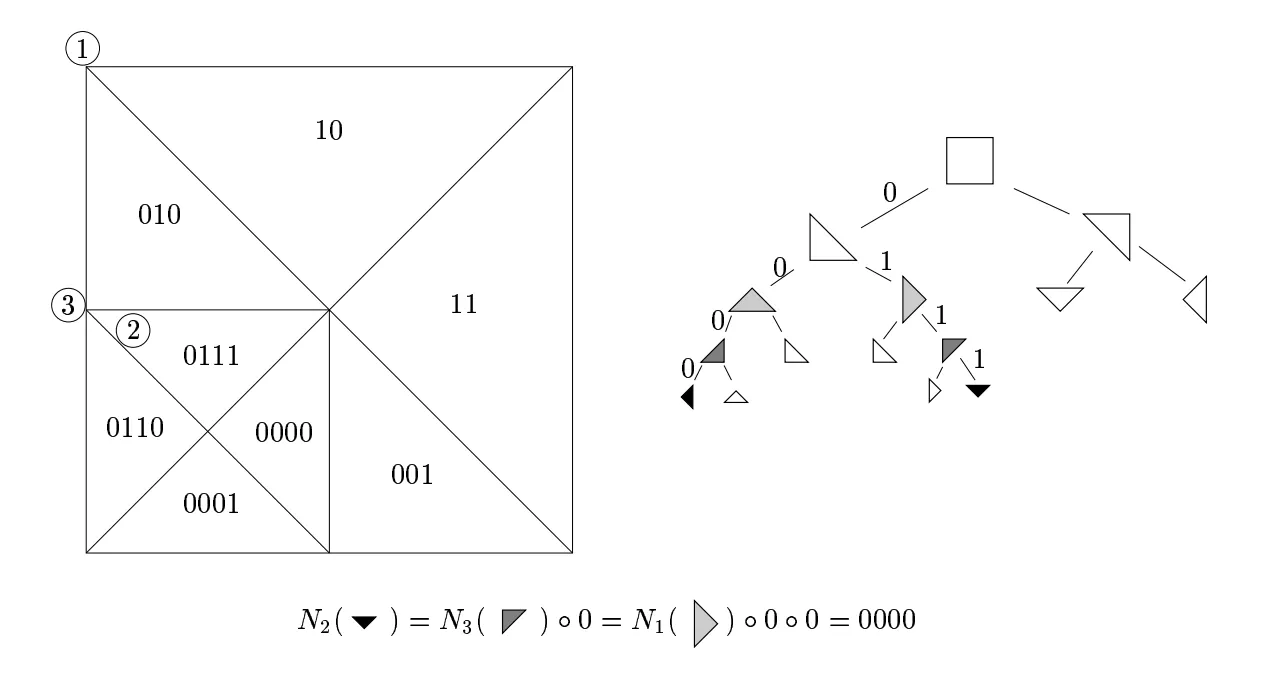
Each tile and its terrain are represented as squares. Repeatedly dividing each square tile from its right angle to the center of its hypotenuse forms isosceles triangles, saving the two vertices of each hypotenuse.
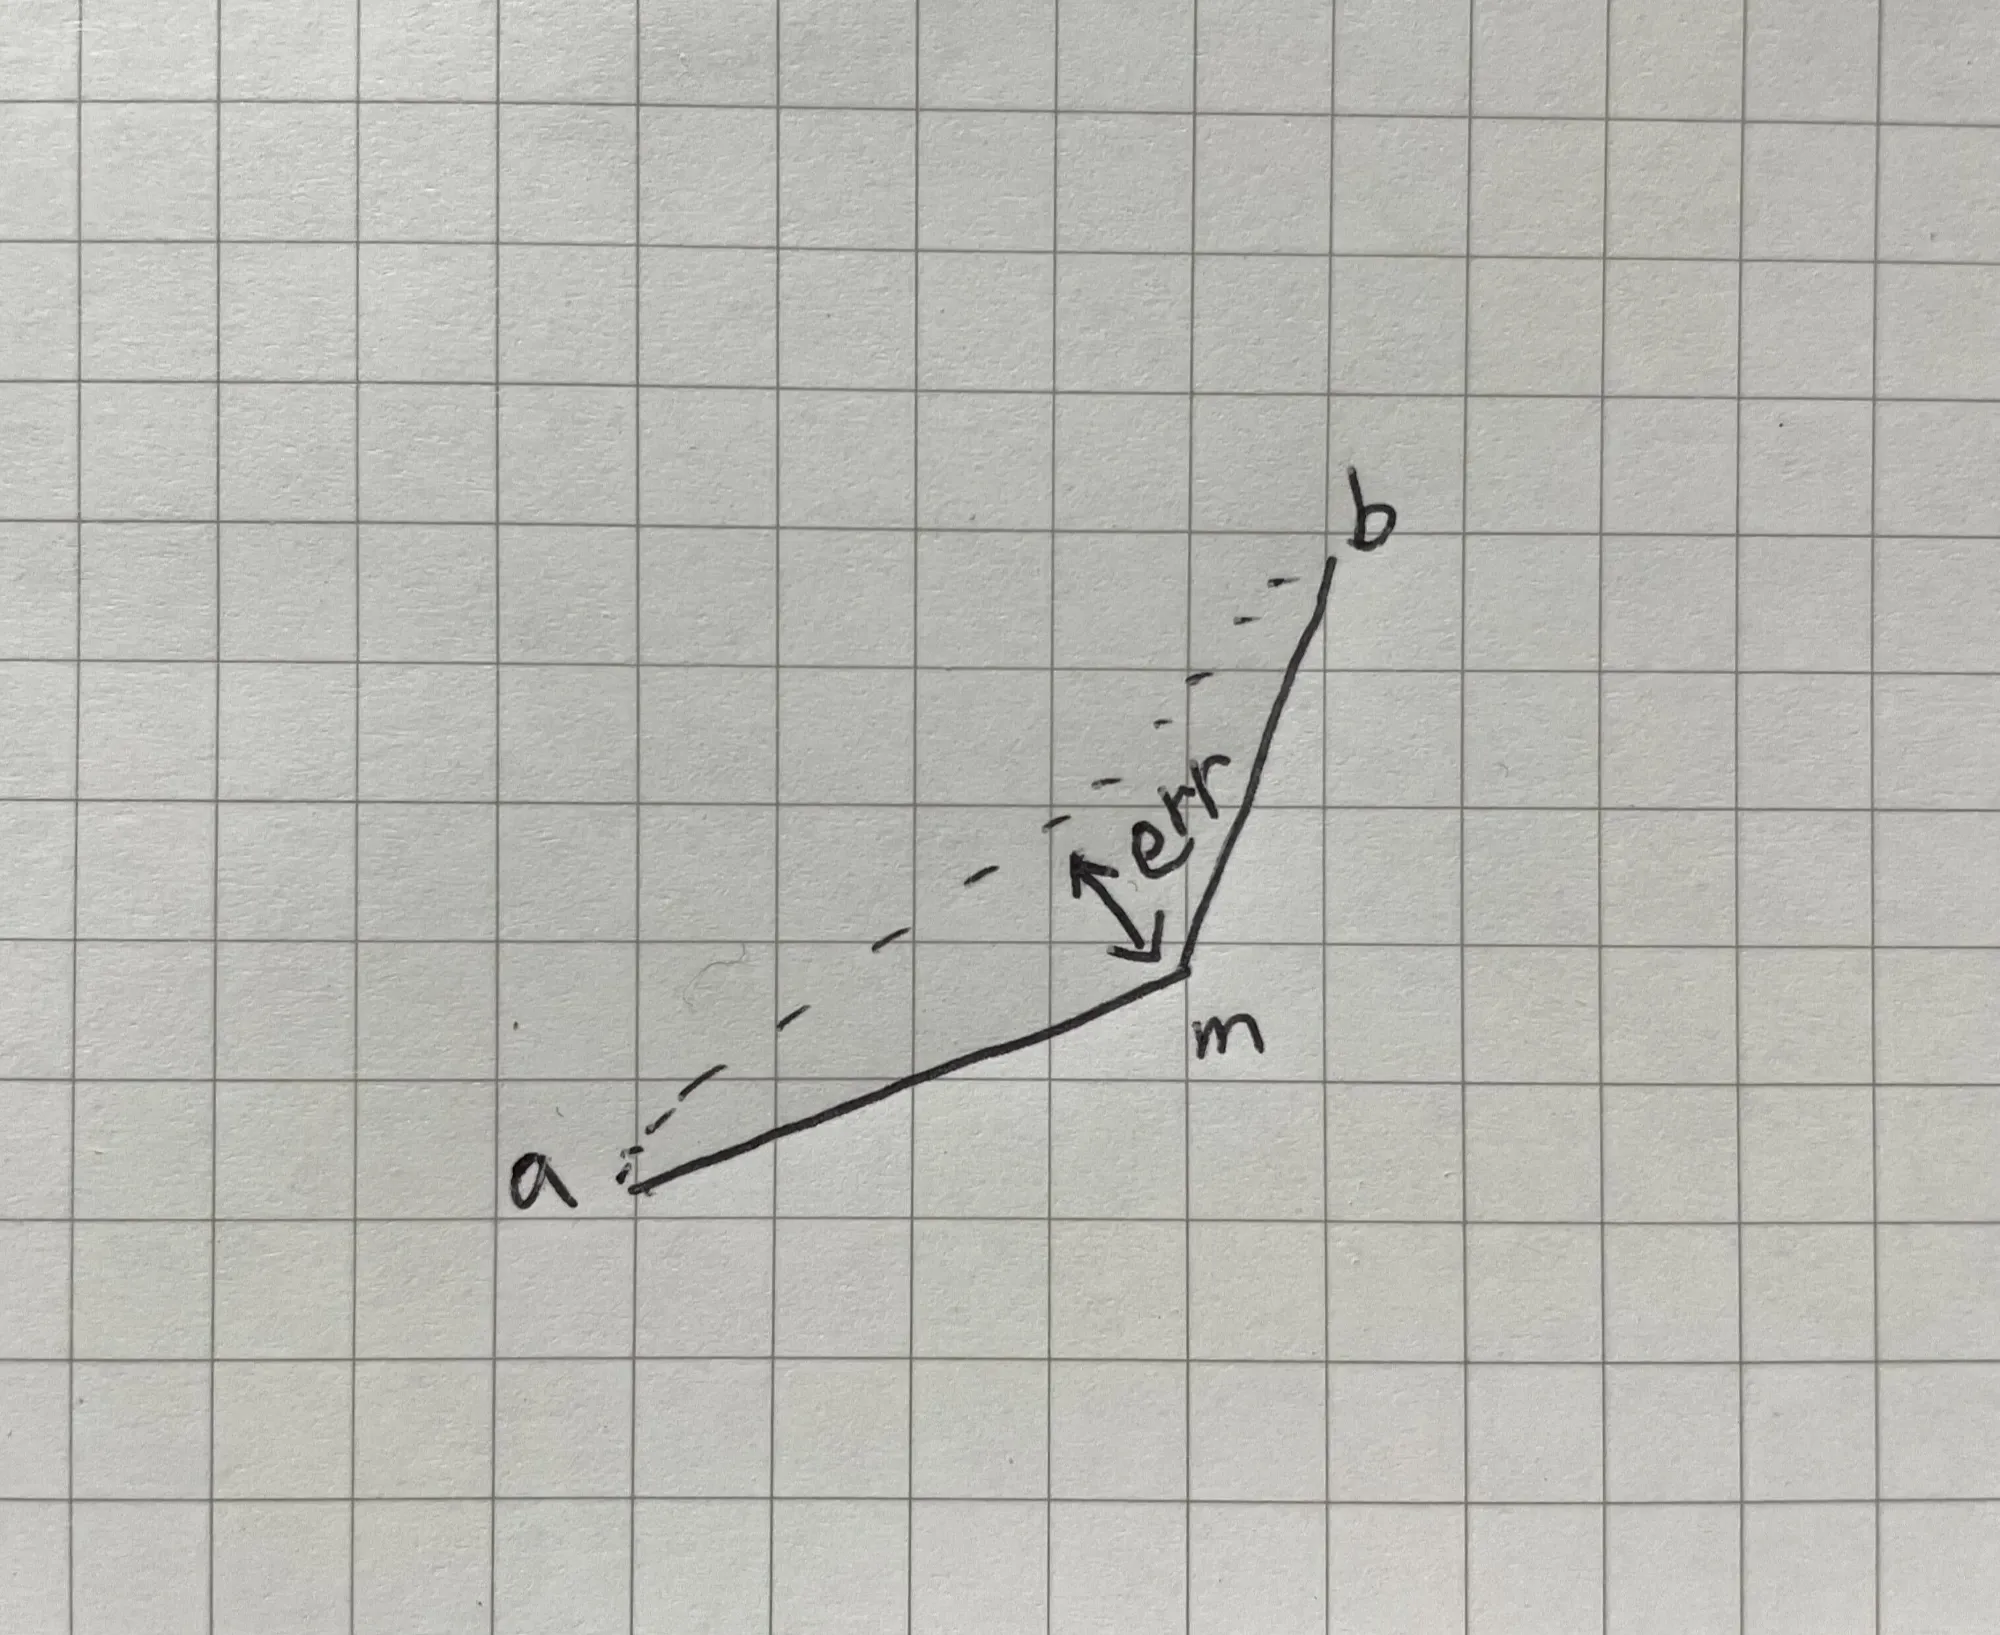
Next, heights for vertices a and b are retrieved, and a linear interpolated value is calculated. The height difference (error) between the midpoint m and the interpolated value is calculated.
As shown below, the error increases as the hypotenuse lengthens, while subdividing reduces error.
Next, we specify the maximum allowable error and compare each hypotenuse’s error. Appropriate hypotenuses are selected to keep the error below the maximum tolerance.
Because the split information is hierarchically managed, the optimal LOD can be selected based on maximum error.
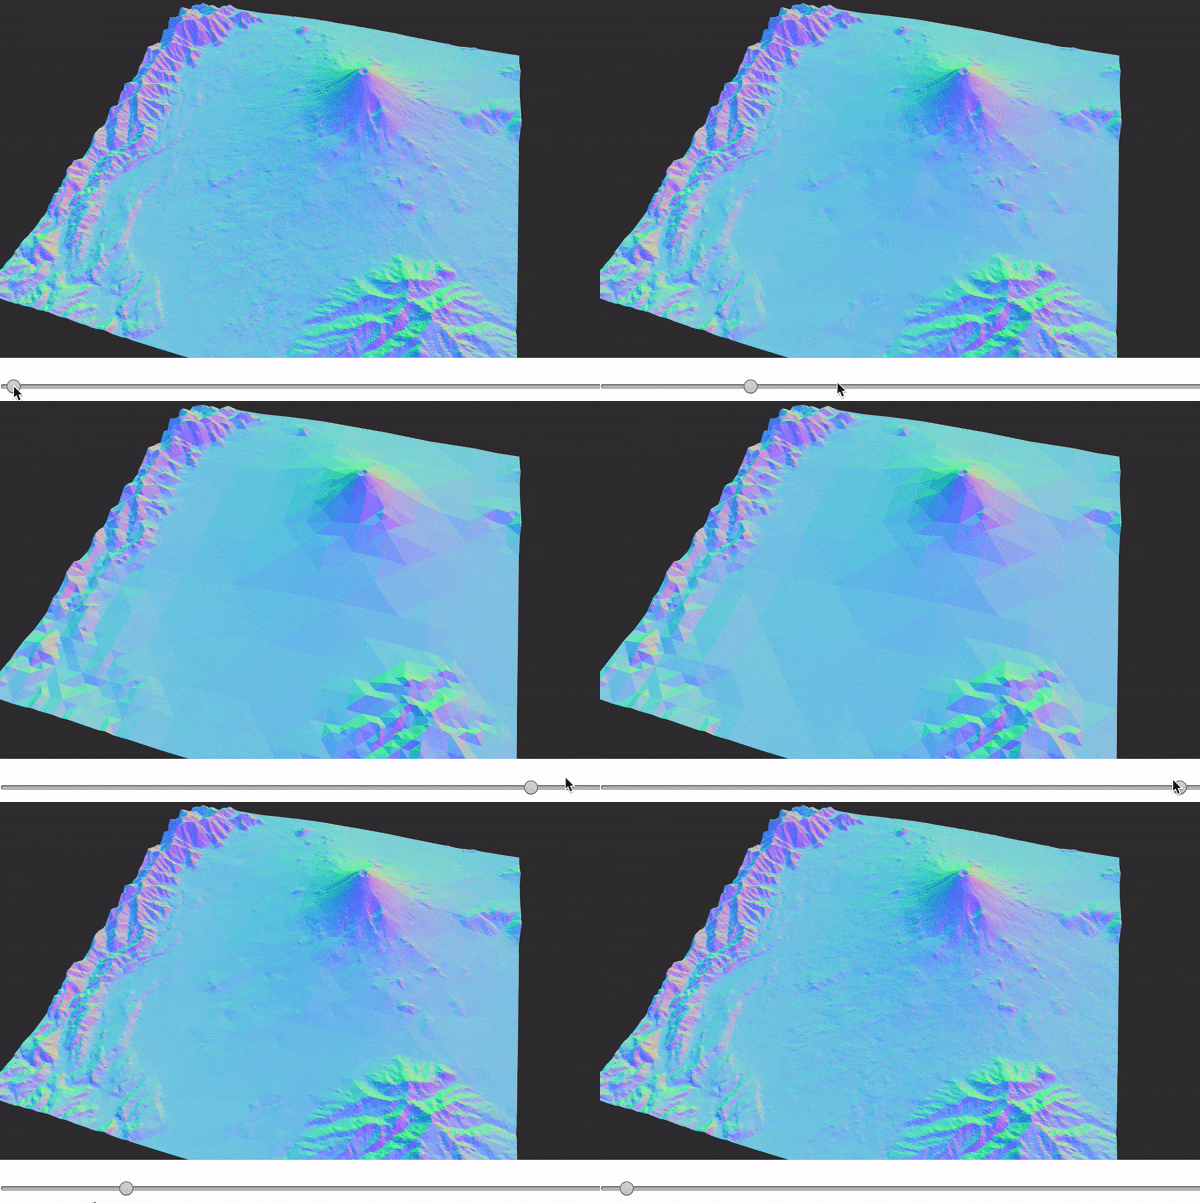
As shown below, reducing error tolerance increases triangle count, creating a high-poly model, while a higher tolerance reduces triangle count, creating a low-poly model.
In flat terrain, minimal error allows fewer vertices, as short hypotenuses aren’t needed.
What is MARTINI?
MARTINI is a JavaScript library that implements this algorithm and performs efficiently in real time.
The GIF below demonstrates how adjusting MARTINI’s maximum error tolerance changes LOD.
Conclusion
Inspired by MARTINI, we implemented RTIN in our map engine. This simple algorithm effectively reduced vertex count, preserving visual quality by adjusting vertex density according to elevation changes.
Though not precisely measured, the vertex count decreased from about 10,000 to 6,000 after applying the algorithm, and down to 1,000 in flat areas.
Thank you.
Eukaryaでは様々な職種で採用を行っています!OSSにコントリビュートしていただける皆様からの応募をお待ちしております!
Eukarya is hiring for various positions! We are looking forward to your application from everyone who can contribute to OSS!
Eukaryaは、Re:Earthと呼ばれるWebGISのSaaSの開発運営・研究開発を行っています。Web上で3Dを含むGIS(地図アプリの公開、データ管理、データ変換等)に関するあらゆる業務を完結できることを目指しています。ソースコードはほとんどOSSとしてGitHubで公開されています。
➔ Re:Earth / ➔ Eukarya / ➔ note / ➔ GitHub
Eukarya is developing and operating a WebGIS SaaS called Re:Earth. We aim to complete all GIS-related tasks including 3D (such as publishing map applications, data management, and data conversion) on the web. Most of the source code is published on GitHub as OSS.