The Map Became a Painting Again — Drawing Tiles With a Brush, at the Moment They Are Requested
2026-09-07
I am Hiroki Inoue, CTO of Eukarya. At FOSS4G 2026 Hiroshima, the international conference for geospatial technology, we released Re:Earth Papers — a tile service that serves painted basemaps by drawing them on the spot, once per request. A tile service is the arrangement where a map is cut into small square images and only the area you need is delivered. Like its sibling services Re:Earth Terrain and Re:Earth Buildings, it is open source; the code is on GitHub (reearth/reearth-papers).
Re:Earth Papers replaces the map style with a node graph — the arrangement where processing is expressed as boxes joined by wires — and replaces the symbolizers that say how lines, areas and text should look with a brush engine that lays down real strokes. Tiles are drawn on the spot, at the moment they are requested. Instead of handing out tiles generated in advance, it delivers basemaps painted in watercolour, ink, pencil or woodblock through the same on-demand framework as terrain.
This article is about what is inside. In the order we built them, here are the pieces that let us say the map became a painting again.
What Re:Earth Papers serves
Before the mechanics, a quick look at what actually goes out over the wire. papers.reearth.land is an image tile service that puts many tilesets on one shelf. It is free, and it needs no API key. CORS is enabled so another website can load it directly, which means it drops straight into MapLibre or Cesium as a basemap.
Here is what is on the shelf.
- Plain cartographic themes (
papers-light/papers-dark, the Protomaps family, and others) — OpenStreetMap vector tiles, drawn into a single raster image by our renderer - Painterly themes (
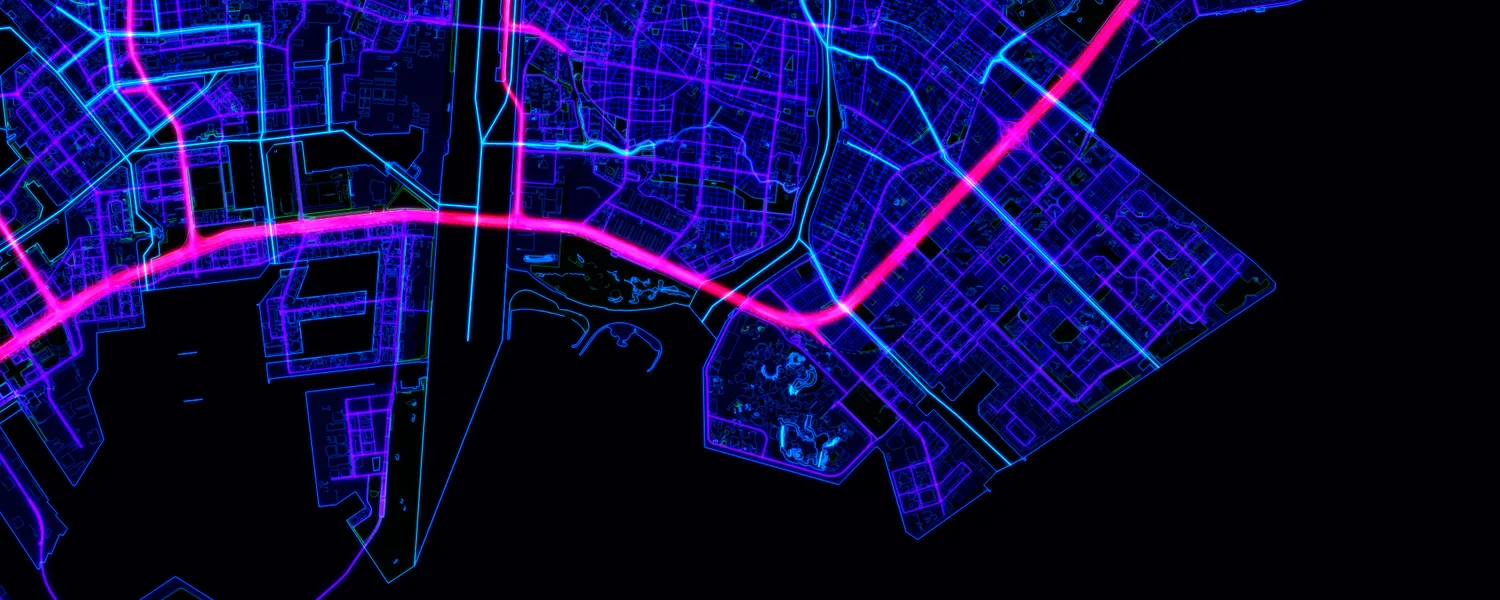
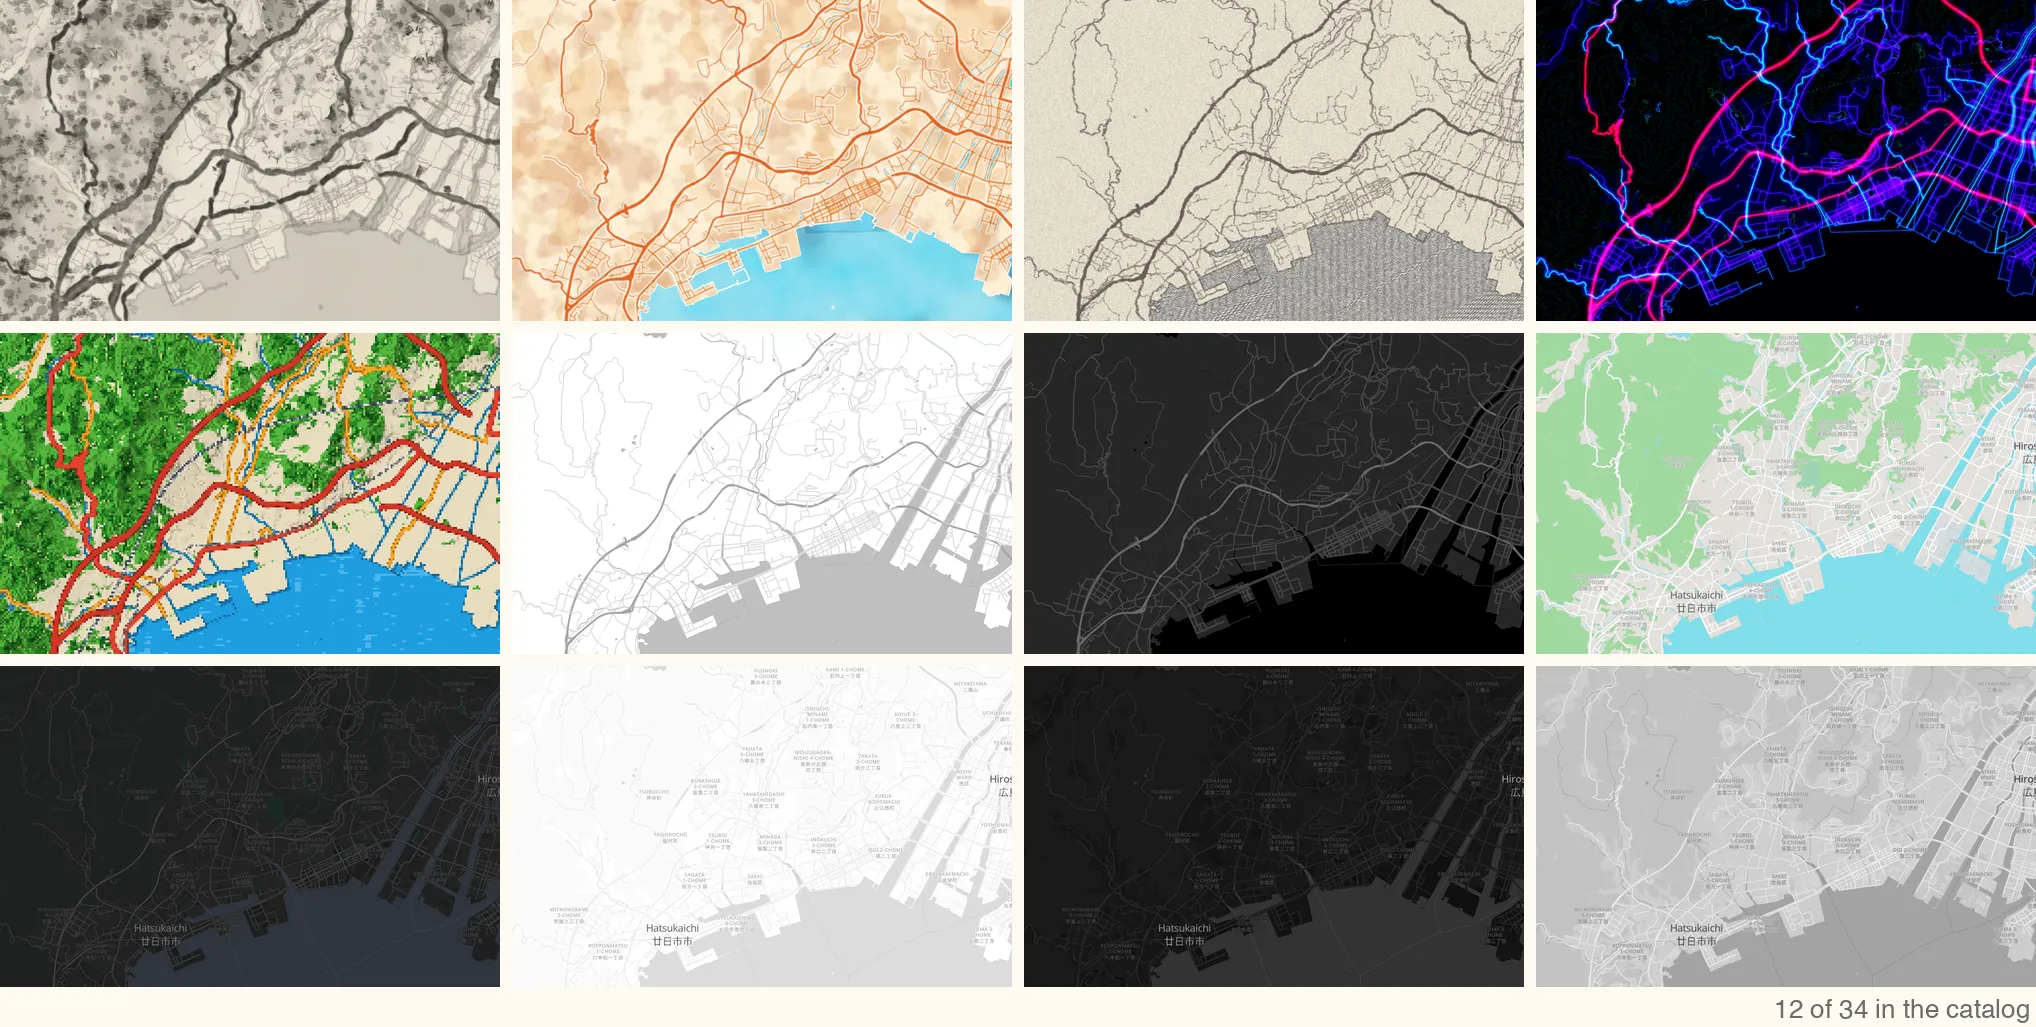
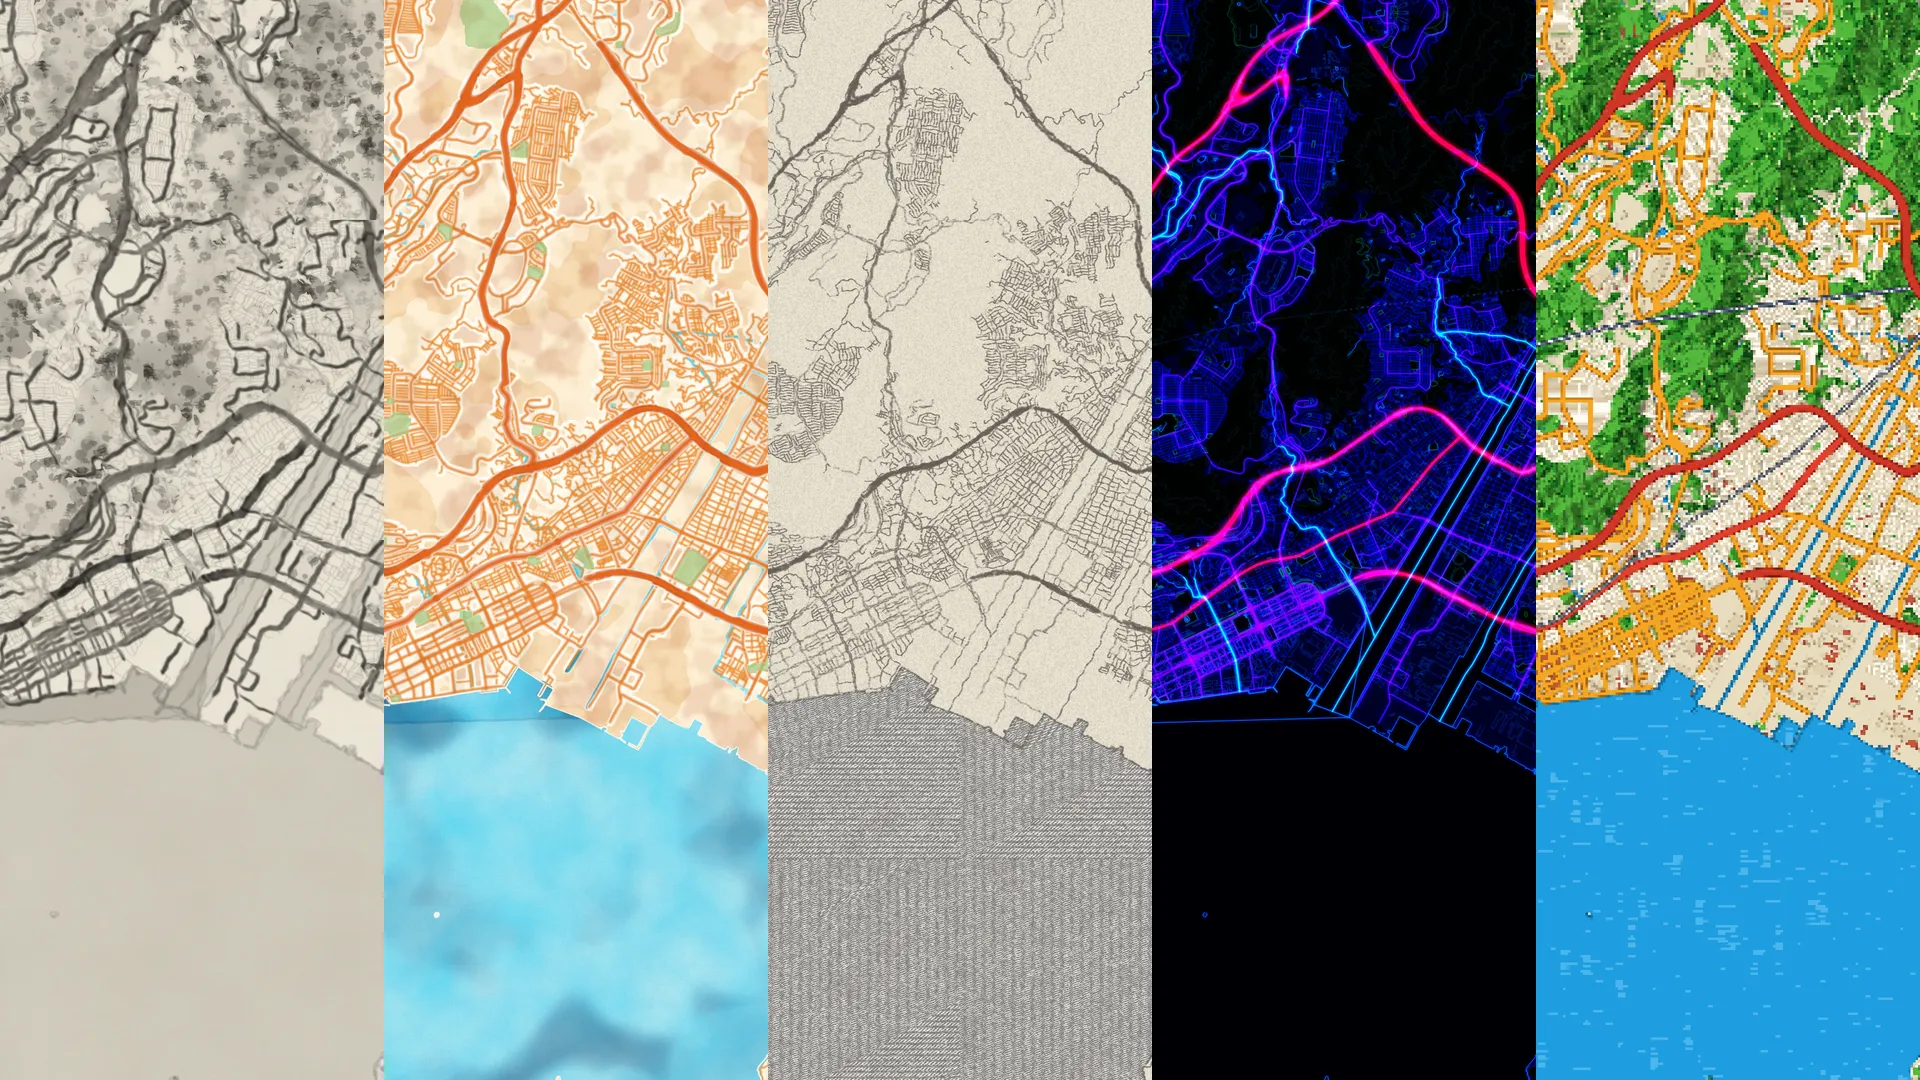
paint-sumi/paint-wash/paint-pencil-sketch, and more) — the same OSM data, painted by a brush engine - Data layers — Natural Earth, Overture Maps, ESA WorldCover, NASA Black Marble, Stamen Watercolor and other openly licensed map data, served both as TileJSON (the configuration file that records tile URLs and extents) and as plain z/x/y URLs
Putting a painterly theme under Cesium is this much code.
import * as Cesium from "cesium";

const imagery = new Cesium.UrlTemplateImageryProvider({
  url: "https://papers.reearth.land/styles/paint-sumi/tile/{z}/{x}/{y}.webp",
  tileWidth: 512,
  tileHeight: 512,
  credit: "© OpenStreetMap contributors, Mapterhorn",
});

const viewer = new Cesium.Viewer("cesium");
viewer.imageryLayers.addImageryProvider(imagery);
From MapLibre GL JS, you hand the TileJSON to a raster source and you are done.
map.addSource("papers", {
  type: "raster",
  url: "https://papers.reearth.land/styles/paint-wash/tilejson.json",
  tileSize: 512,
});
map.addLayer({ id: "papers-layer", type: "raster", source: "papers" });
Everything that follows runs behind those two short snippets.
Today's map style is a list of rules
When you draw a map on the web, the style is written as a list of layers in the order they are drawn. The MapLibre GL Style Spec, the drawing rules for web maps, shares its root idea with the Mapbox lineage, with CartoCSS and with SLD, however much the surface syntax differs. "This line is 2px green." "This area is pale beige." "This name is 12pt bold." You line up the settings handed to a drawing rule, and you paint from the bottom upward. That has been the shared language for drawing maps into tiles.
The clear strength of this model was that properties could take expressions. Being able to vary colour, width and size continuously by zoom or by feature attribute was an enormous step forward for a list of drawing rules. interpolate / step / match, the expressions in MapLibre, became basic vocabulary for cartographic design.
QGIS and SLD extend that line further, with Porter-Duff compositing for how images stack, Shapeburst for shifting colour inward from the boundary of an area, Random marker fill for scattering symbols, Geometry generator for deriving one shape from another, and a range of paint effects. We do not think GIS styling is short of expression. As a list of drawing rules that can compute, it has already come a very long way.
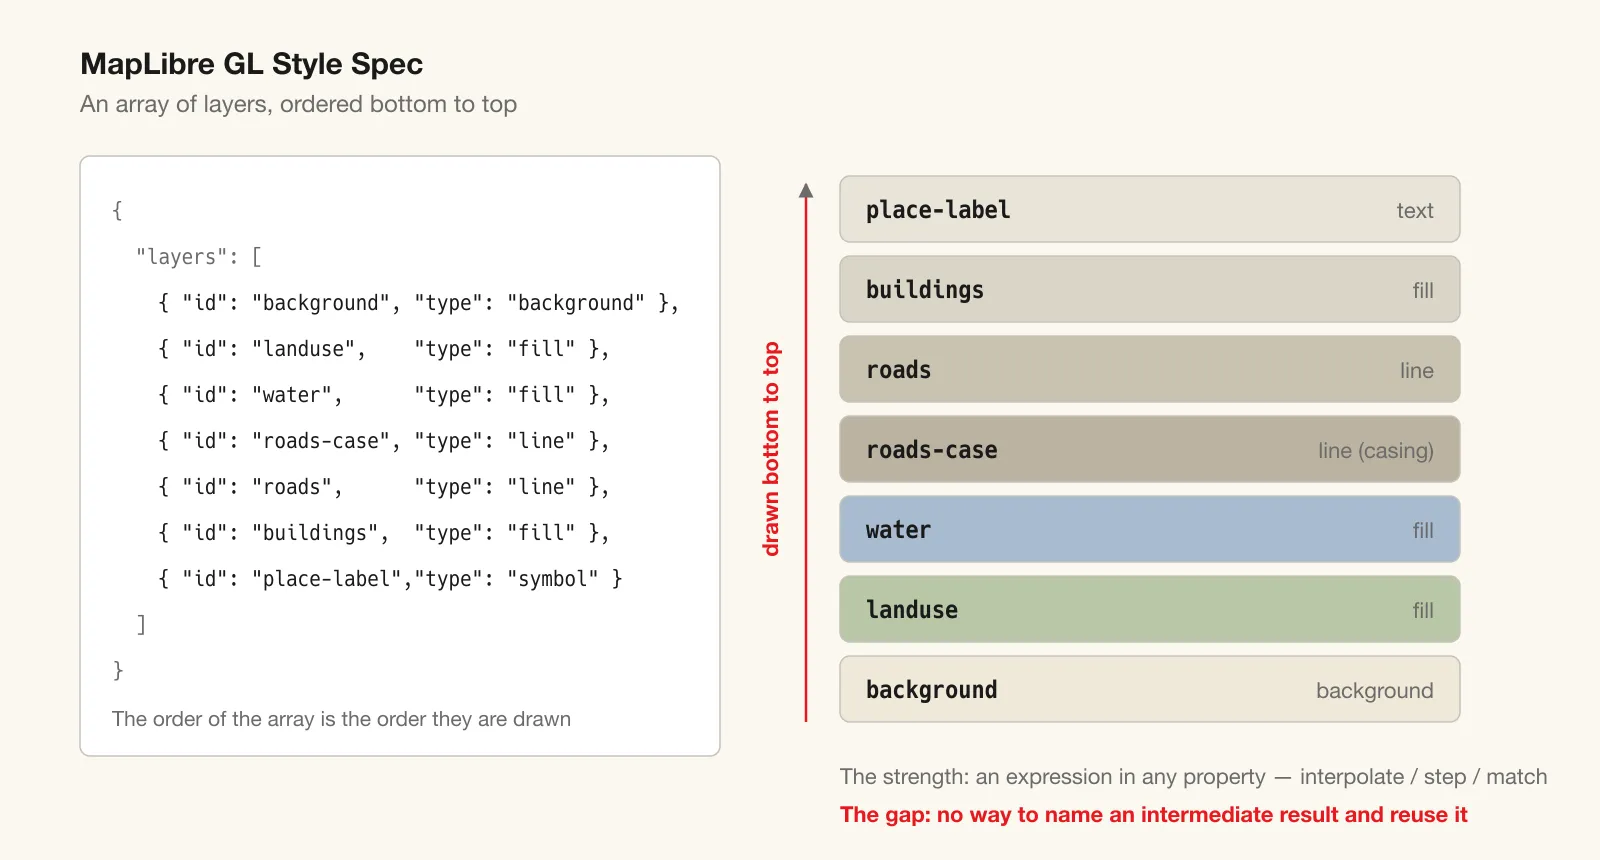
What this shared language cannot do, though, is paint. There are two reasons. The first is that there is no way to name the output of one step and feed it into a later one. A blurred raster used as a mask, and the same raster used as the base of a blend — an ordered list cannot express that shape. The second is that the brush that stacks dabs — the mark left where a brush touches down once, carrying pressure, water and pigment mixing, laid down continuously along a shape — simply does not exist among conventional drawing rules.
Without both of those, a painted map never gets inside a tile service.
Maps used to be paintings
Look at the Tenpo provincial map of Suō and you notice that the brushwork changes from mountain to mountain. One ridge is soft, drawn with a brush carrying plenty of water. Another is cut in short strokes with a dry brush, the way scrub reads. Someone chose a brush for that particular mountain. Back when a map was a painting rather than a list of information, that was ordinary.
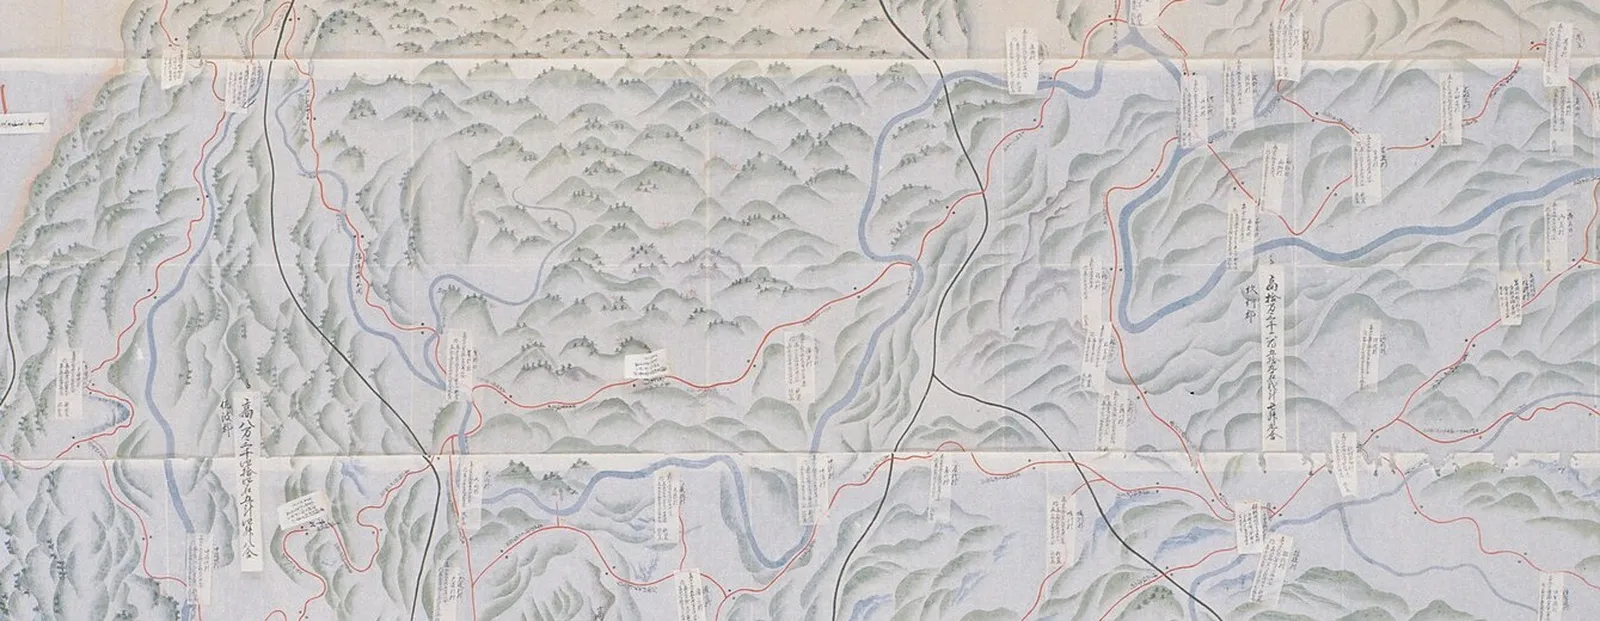
The modern framework for serving web maps was never built to carry that hand. The reason is the one above: the style was simplified into a list of rules, and the tools for painting were not among them.
There are exceptions. What Stamen Watercolor showed in 2012 was that a map can be painted in watercolour — as one theme, baked into raster tiles. As the rest of this article argues, the raster tile itself was always a sufficient frame for painting. What was missing was the software to make painting hold up as painting even when it happens once per request.
The rest of this article is about the two tools we assembled there: the brush engine hokusai, and the node graph renderer ezu.
To paint, you first need a brush — hokusai
Painting software has a component called a brush engine. It takes the movement of a mouse or a pen tablet and builds a stroke by stacking dabs onto the canvas. Several inputs — pressure, speed, tilt, randomness — are converted into fix15, a fixed-point format in which 1.0 is 32768, so fractions are carried as integers and the rounding does not shift with the platform the way floating point can, and folded into a continuous mark.
Photoshop, CLIP STUDIO, Krita, MyPaint, Procreate, Painter — people who paint each have a brush engine they like. Among them, libmypaint, the engine used by MyPaint and Krita, is the most widely adopted open-source implementation.
What we needed was to run libmypaint inside a web map service. So we built hokusai, a brush engine implemented in pure Rust.
The top design priority for hokusai was not a look of our own, but reproducing libmypaint's result pixel for pixel. The same fix15 numbers, the same 64×64 RGBA tile structure, the same stroke computation. It reads .myb brush data written for libmypaint without conversion, and returns output that matches almost bit for bit.
Measured against libmypaint v1.6.1, 188 of the 196 stock brushes (about 96%) come within a mean absolute pixel difference (MAD) of 0.5, and the remaining eight stay under MAD 4. The test program that keeps checking this, hokusai-compat, ships in the repository; run cargo xtask brush-pack-report and anyone can reproduce the same measurement.
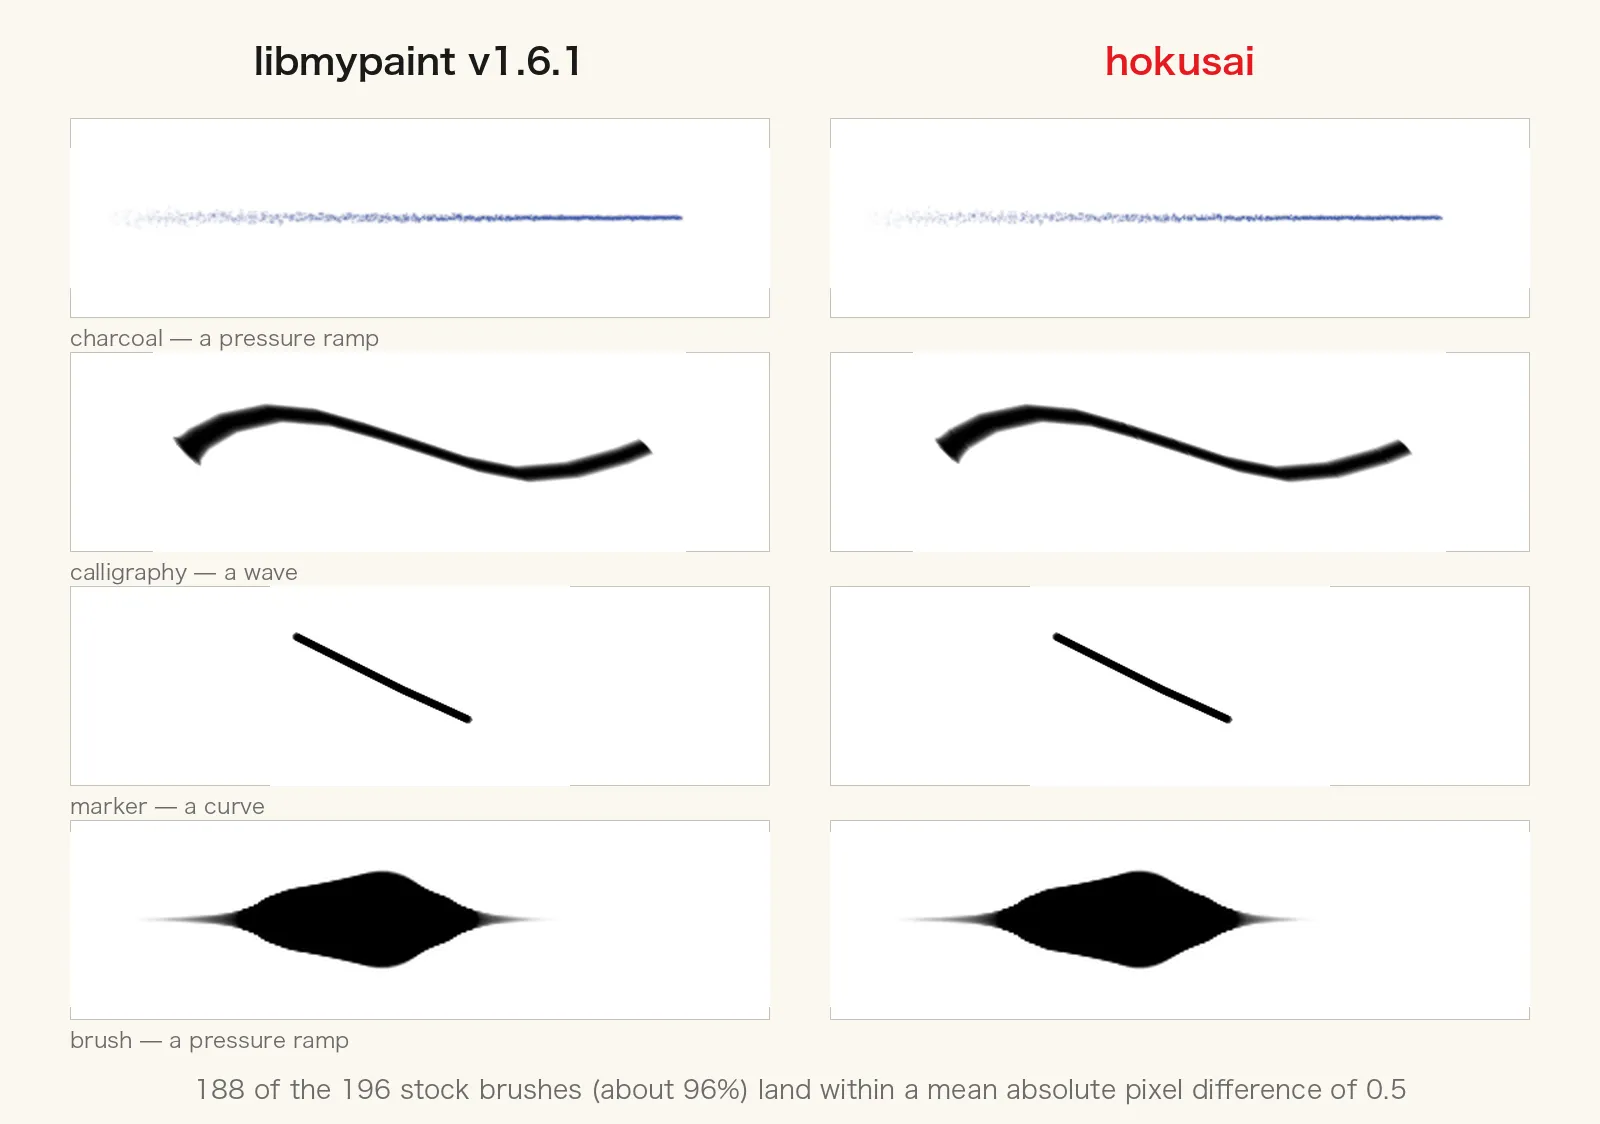
Why reimplement libmypaint at all? Because we needed it as WebAssembly (WASM), able to run in a browser and on Cloudflare Workers. libmypaint is a native shared library and cannot be carried into a WASM runtime like Cloudflare Workers. Nor can the existing Web Canvas compositing modes stand in for a brush — libmypaint's brush is a dedicated engine that takes pressure, speed, tilt and randomness and stacks dabs using fix15 arithmetic.
That gives us the first of the two tools for painting — a brush that lays down dabs — working the same way in a browser and in WebAssembly on Cloudflare Workers. What we needed next was a language for saying what that brush should be applied to, and how.
The other tool for painting — node graphs, and ezu
Above the brush engine, painting software has one more large idea: the node graph.
Blender, Nuke, Houdini, Substance Designer and much of the rest of the CG and film production toolchain express processing as boxes joined by wires. That the shared language for making an image is a node graph has been a given in CG and VFX for decades. The reason is plain: an ordered list struggles to express the feel of reusing a named intermediate result in several later steps.
In CG this way of working is called procedural generation. Instead of holding the finished image as data, you hold the steps that make it, as a graph, and re-run them with different parameters as often as you like. The terrain and cities of Houdini, and the materials of Substance Designer — procedural textures — are all built this way.
Put into cartographic vocabulary, this turns out to be a strikingly familiar idea — a style has never been the picture; it has always been a description of how to draw the picture. The difference is only in how far you are allowed to take the description.
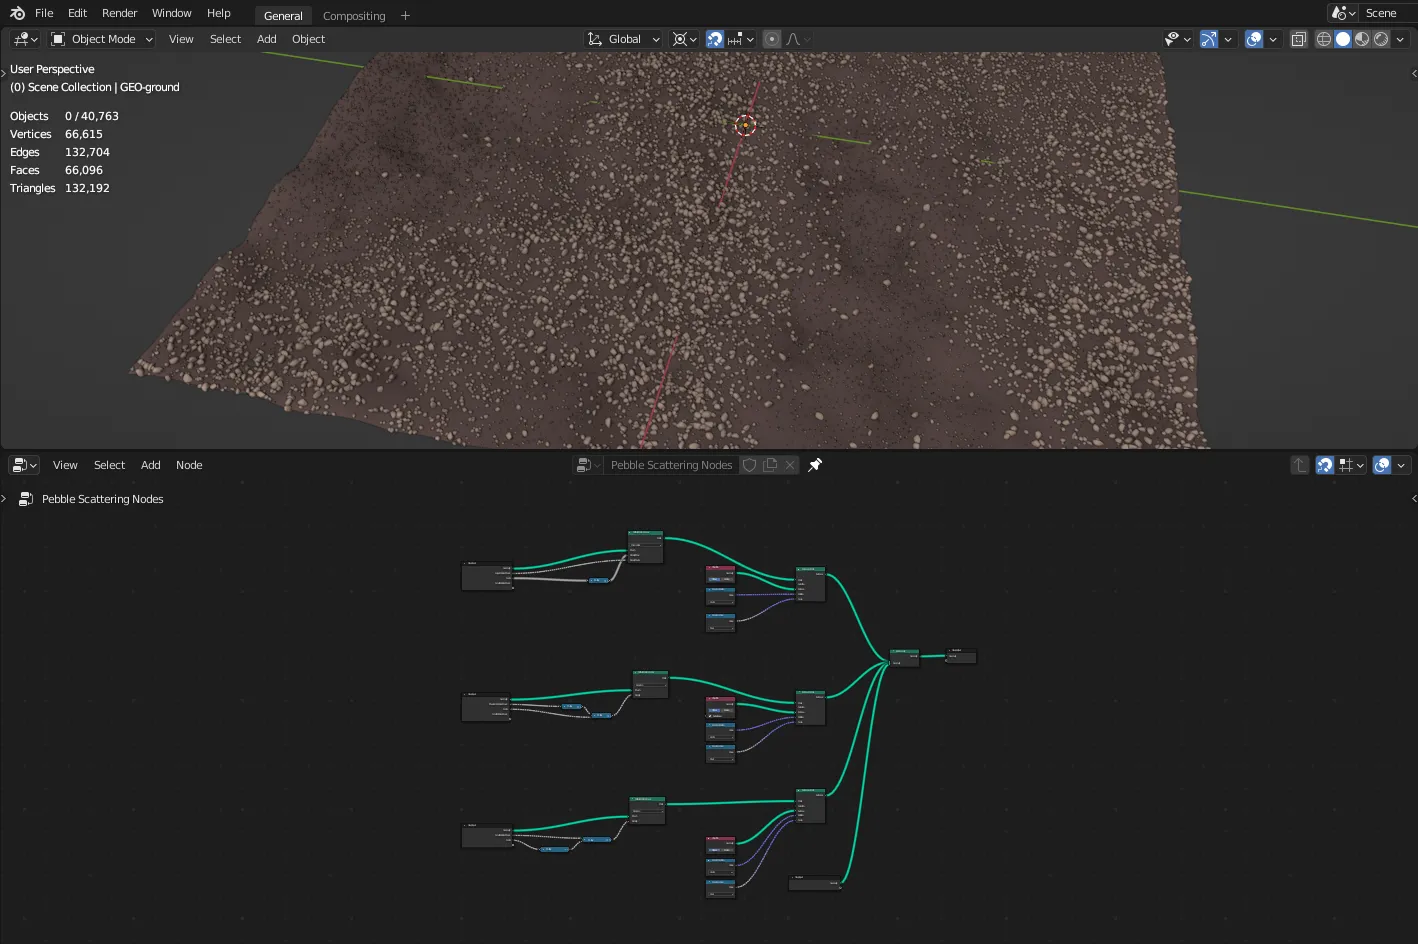
Compositing a film shot in Nuke, you might take a blurred layer and use it as a matte, as the base of another blur, and as the region for a colour correction. In an ordered list you would either repeat the same blur several times or design around leaving intermediate results on the canvas. In a node graph, one blur node's result is simply used by three downstream steps.
This idea never made it into GIS map styling. GIS styles stayed an array of layers; CG and VFX stayed a processing graph; each grew up in its own field. Rendering in Re:Earth Papers is an attempt to close that gap, and the piece that does it is ezu (絵図, "picture map"), a renderer written in Rust.
What decisively separates ezu from an existing renderer like MapLibre GL is that it treats a style as an acyclic processing graph (a DAG) in which every step has declared input and output types. Summarised bluntly, a MapLibre style document is an array of layers: read top to bottom, stacked onto the canvas in that order. An ezu style document is a map of named nodes. The order does not live in the document; it stands up only when you follow each node's @ref back from output.
{
  "nodes": {
    "bg":      { "op": "solid", "color": "#fbf6e6" },
    "water_f": { "op": "features", "layer": "water" },
    "water":   { "op": "fill-dabs", "features": "@water_f", "color": "#5876a0" },
    "soft":    { "op": "blur", "input": "@water", "sigma": 3 },
    "out":     { "op": "blend", "base": "@bg", "over": "@soft" }
  },
  "output": "@out"
}
out uses the results of bg and soft; soft uses water; water uses water_f. A value beginning with @ is a reference to another node's result. Read backwards from the output, the chain of dependencies is already the processing graph. ezu currently has 85 operators, sorted into seven broad categories. Each category name in the table below links to its documentation page, where every operator is shown as a before-and-after pair — for working out what a node actually does, looking at it is by far the quickest route.
| Category | Examples | What it does |
|---|---|---|
| source | features / dem / image / graticule / point-grid | Reads features, elevation and images |
| geometry | buffer / dash / hatch / voronoi / simplify | Works on the shapes themselves |
| paint | stroke / line / fill-solid / fill-dabs / stamp / text-labels / text-draw / label-placement | Draws shapes as images (what a symbolizer used to do) |
| raster | blend / blur / noise / warp / hillshade / gradient-linear / color-ramp / stack | Processes images |
| brush | brush-file / brush-solid | Loads a brush (hokusai) |
| scalar | expr / math / zoom | Computation and branching inside the style |
| util | Conversion utilities | — |
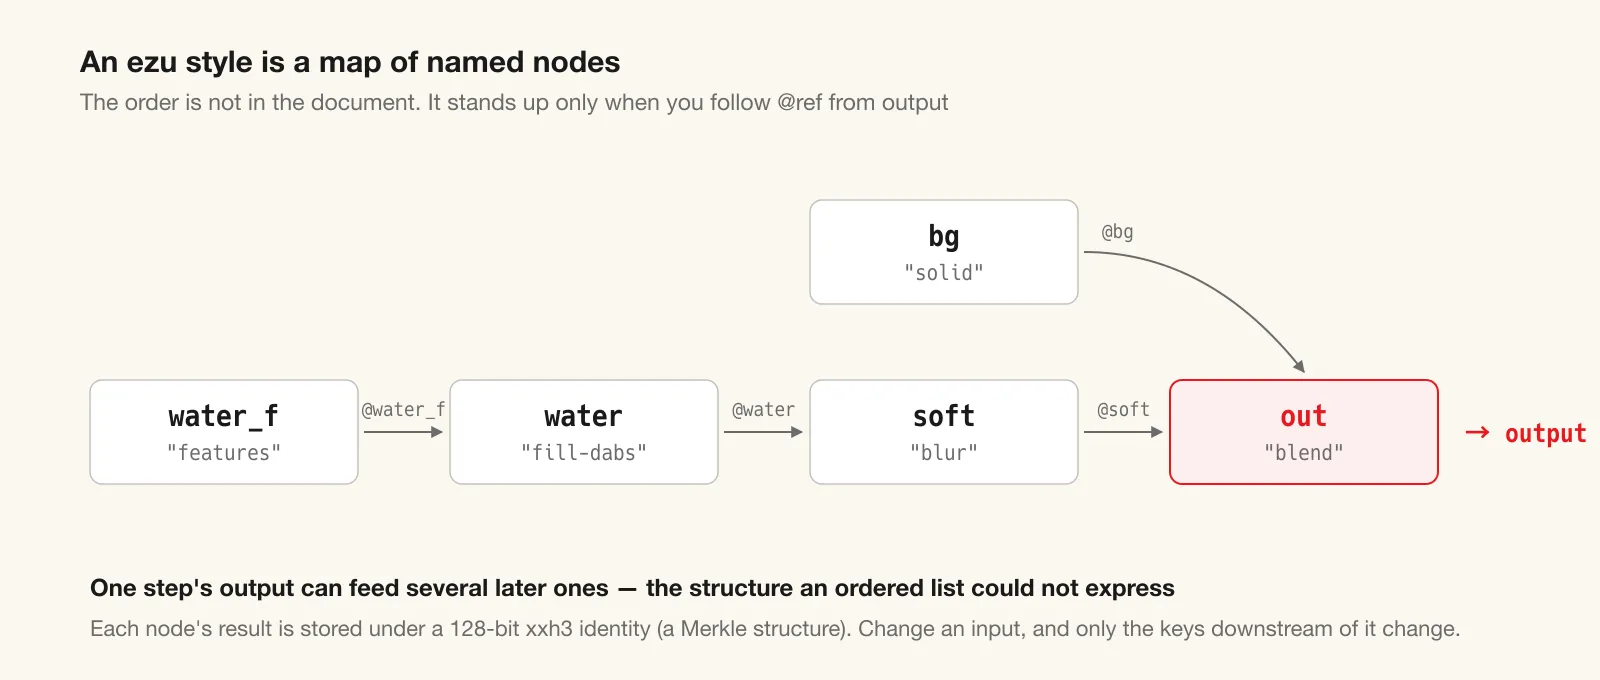
The difference between an ordered list and a node graph is not only a difference in feel. It is a structural difference: one step's output can be taken as input by several later steps. Rasterise the coastline once, then use it as a clip region, as an outline, and as the input to a distance-to-coast field — an idea that would need rewriting in an ordered list is, in a graph, one node and several consumers of its result.
That difference also changes the granularity of caching. ezu stores each node's output under a key: a 128-bit identity computed from the content with the fast hash function xxh3. The key is assembled from the canvas geometry, the tile ID, that node's settings and materials, and the identities of its input nodes, concatenated in order. This is what is known as a Merkle structure: when an input changes, only the keys of the steps affected downstream change, and every other result can be reused. A design that repeatedly overwrites one canvas in order, as an ordered list does, cannot cache at that grain.
This per-node key comes back in the next section: once a node decides where to place things from world coordinates rather than tile coordinates, it can drop the tile ID from its key altogether.
ezu's paint nodes — fill-dabs, line and stamp in particular — embed hokusai as their brush engine and walk dabs along the point sequence taken from a shape. In the browser demo, on a device that reports pen pressure and tilt, you can watch libmypaint's brushes running in a browser as they are.
Killing the seam, in world coordinates
The awkward part of a tile service is that tiles drawn independently can look different from their neighbours. Even with ordered-list drawing rules, plenty of people have watched a fill-pattern shift phase across a tile boundary. Paint with a brush that stacks dabs and the problem becomes far more visible.
ezu solves the seam problem with a design principle: the randomness behind dab positions, noise and label placement is derived from world coordinates, not tile coordinates. It is close in spirit to the fixed-seed option on QGIS's Random marker fill, applied to every place on Earth.
Two tiles covering the same ground place the same dabs at the same positions. Across zoom changes, and across tile boundaries, paper grain and hatching stay in phase. As a side effect, a node that places by world coordinates can drop the tile ID from its cache key, so neighbouring tiles share stored results.
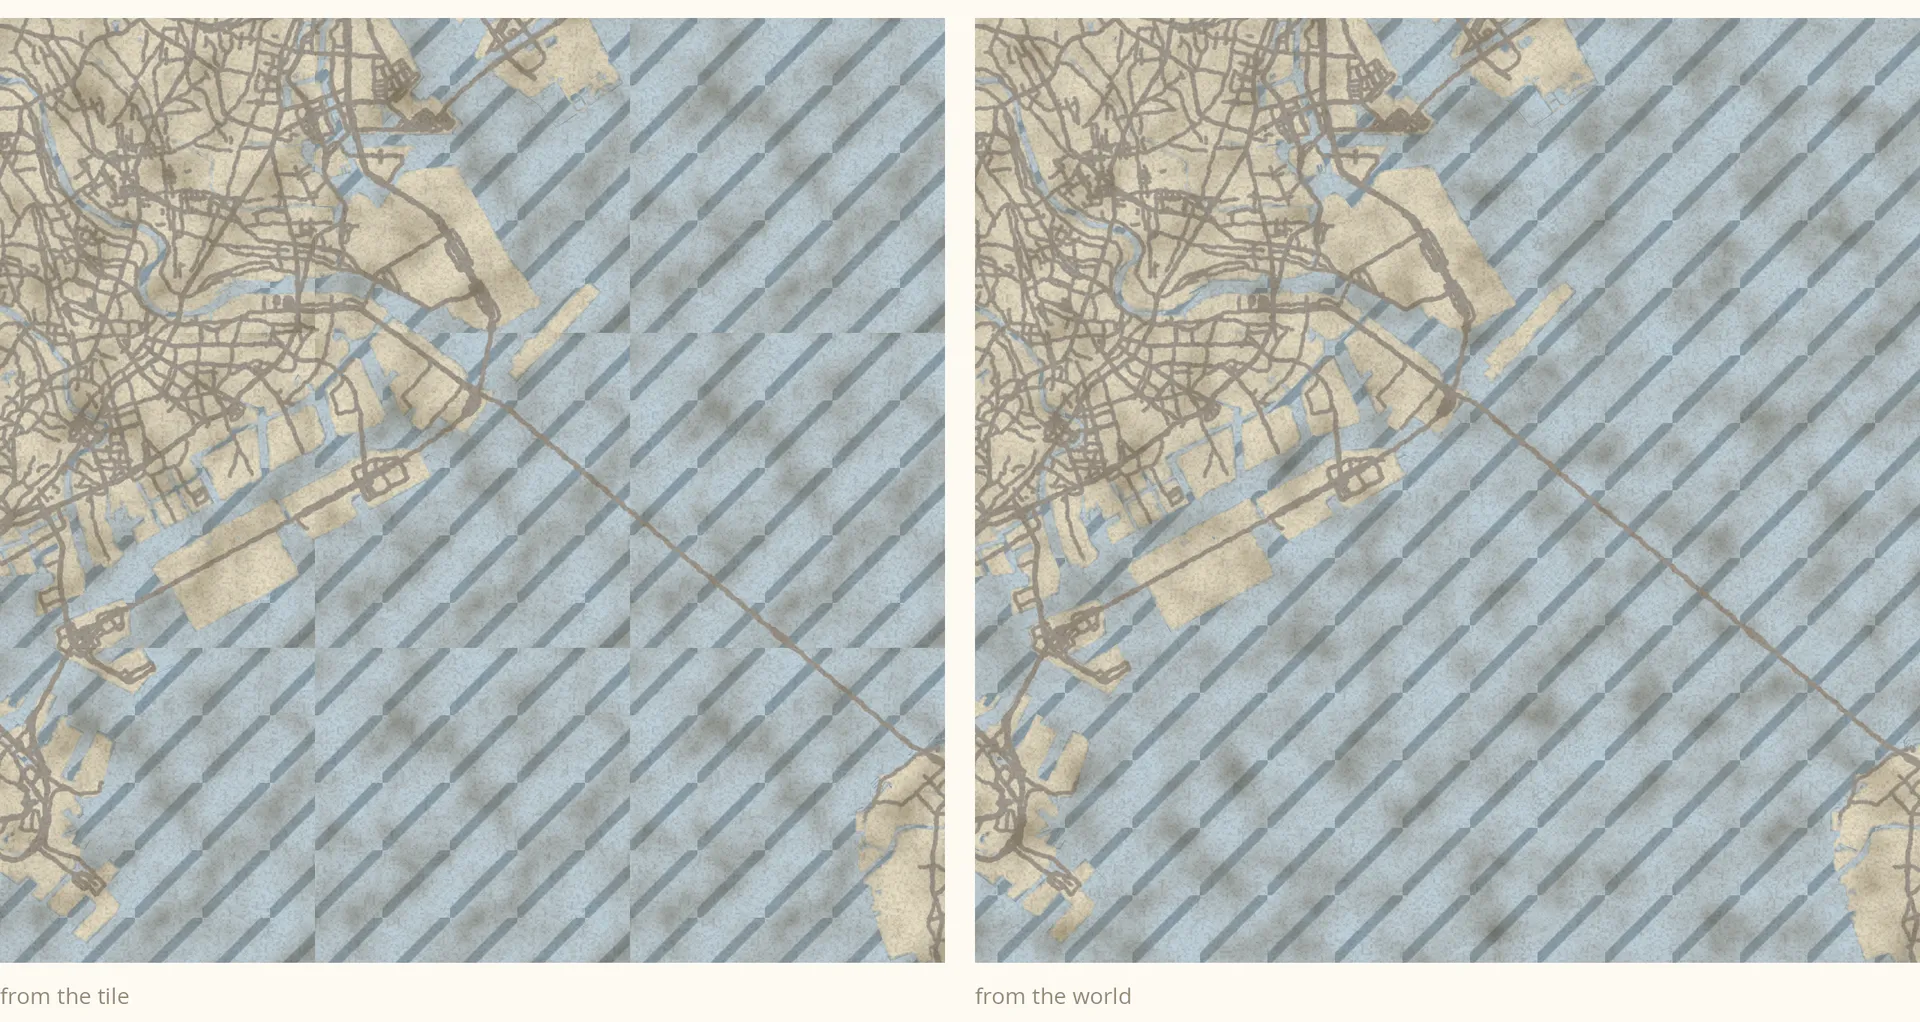
Turn on the tile-boundary grid in ezu serve, the live editing view, and you can confirm it by eye. Dabs run across boundaries without breaking, labels never appear twice, and hillshade does not step. Write it so that the same input always returns the same tile is the watchword here.
Your existing MapLibre style, as is — down to label placement
We did not take this change in a direction that cuts you off from your existing MapLibre style assets. Continuity with MapLibre is our first design constraint.
First, expressions are written exactly as in MapLibre. Everywhere in an ezu node where a value should vary per feature, the field is a *-expr field, and a MapLibre expression goes in as is.
"landuse": {
  "op": "fill-solid",
  "features": "@landuse_f",
  "fill-expr": ["match", ["get", "kind"],
                "park", "#a6c084",
                "forest", "#8fae74",
                "#e8e4d8"]
}
Evaluating that expression is the job of a parser and evaluator written in pure Rust, published as a separate repository, reearth/maplibre-expr-rs. maplibre-expr-rs returns results that are 100% to spec against MapLibre's official test data. The type-checking rules, collator, the geographic functions and the conversion of legacy filters are all included, so the same expression gives the same result.
Second, there is ezu translate, a tool that converts an existing MapLibre style into an ezu processing graph. Layers in sequence become a chain of blend nodes, the nodes that composite images. Reframe each stage of the painter's algorithm as a blend, and an ordered list is nothing more than a special case of a graph. That is what the implementation does.
How closely they agree is documented in numbers too. Drawing a 68-layer Protomaps theme with ezu and comparing it pixelwise with maplibre-gl-js output, SSIM — the measure of structural similarity between images — lands between 0.80 and 0.87. That is after 11 text layers and a graph that swells to 149 nodes. SSIM is 1.0 for an exact match, and the closer to 1, the more the structure agrees. Most of the remaining gap comes from how antialiasing falls and from the label-placement differences described below — not from features or colours landing in the wrong place.
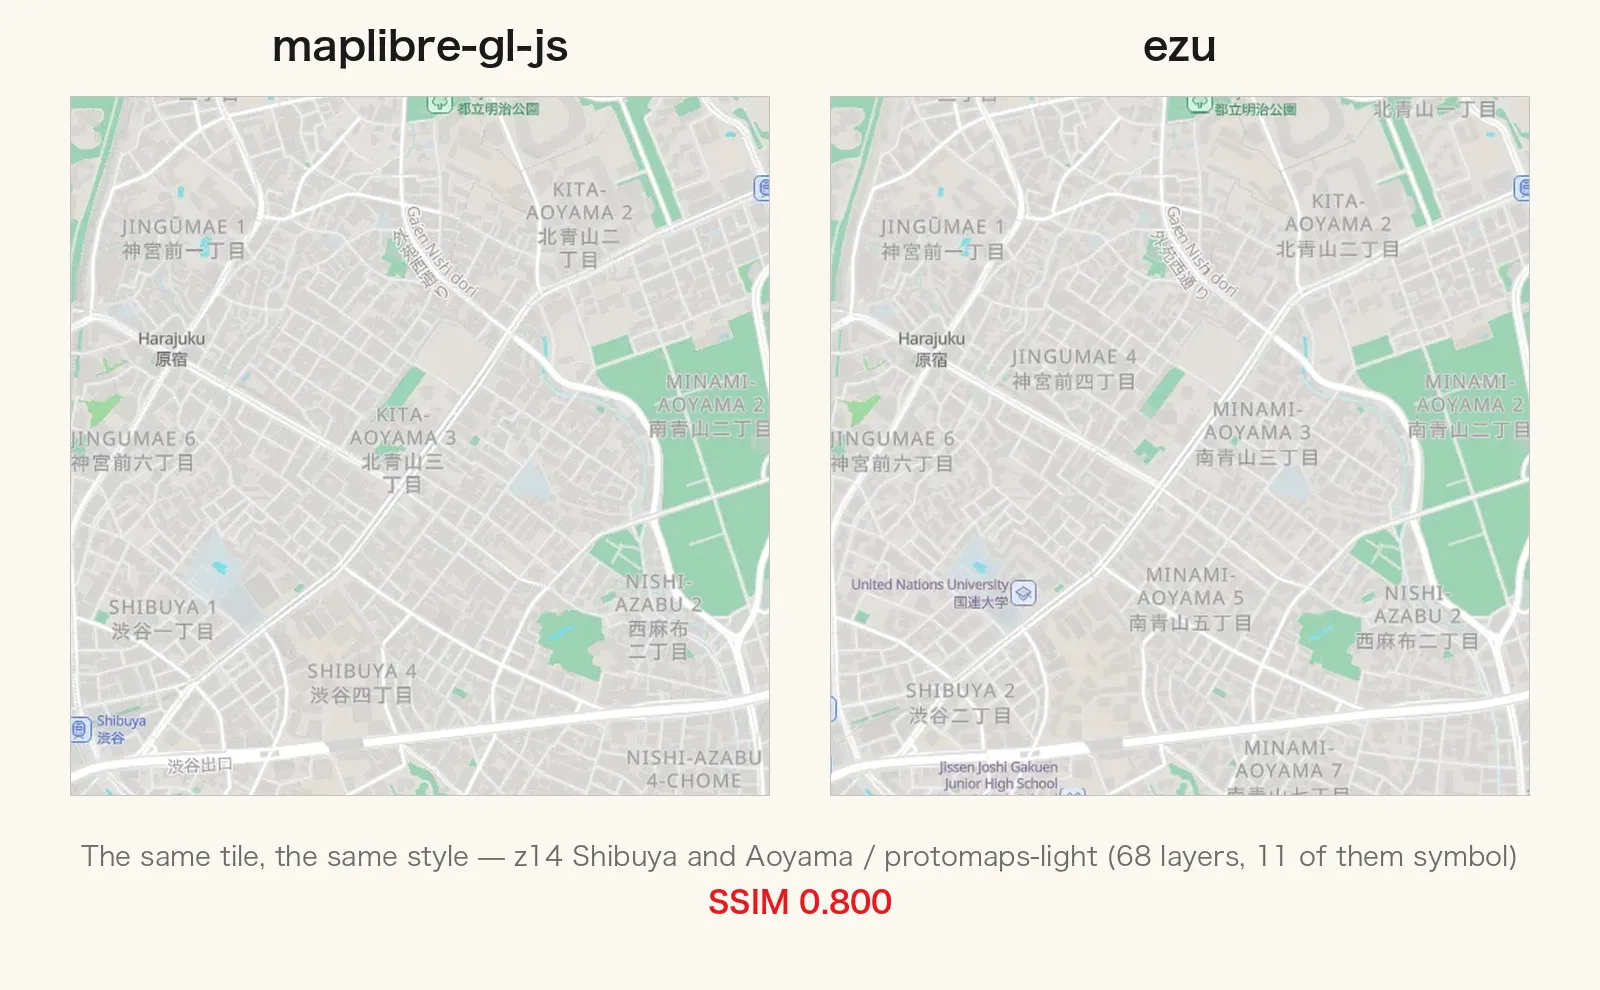
So the plain cartographic themes in Re:Earth Papers are style documents developed in MapLibre, running at the edge unchanged. We have not thrown the existing assets away.
Labels are placed by agreement across the 8 neighbours
The part of a MapLibre style that sits worst with a tile service is label placement. MapLibre re-places labels every frame. It favours tiles near the centre of the current view and fades labels in and out. text-overlap: cooperative behaves dynamically in order to avoid neighbouring labels. That design fits an interactive map client, but it cannot hold in a tile service — when two clients request the same tile, the picture that comes back must not differ.
Label placement in ezu works like this.
- Gather candidates from the 8 surrounding tiles. A text label visible inside one tile may originate from a feature in a neighbour. ezu's
label-placementgathers candidates from the target tile and its eight neighbours, then removes duplicates. - Fix the order. As in MapLibre, ascending
symbol-sort-key, with ties broken by feature order within the tile. - Place candidates that fit, in order. Candidates from every layer go, in order, into one collision index shared across all layers. MapLibre's behaviour where a POI in one layer pushes out a road name in a layer below is reproduced by that shared index.
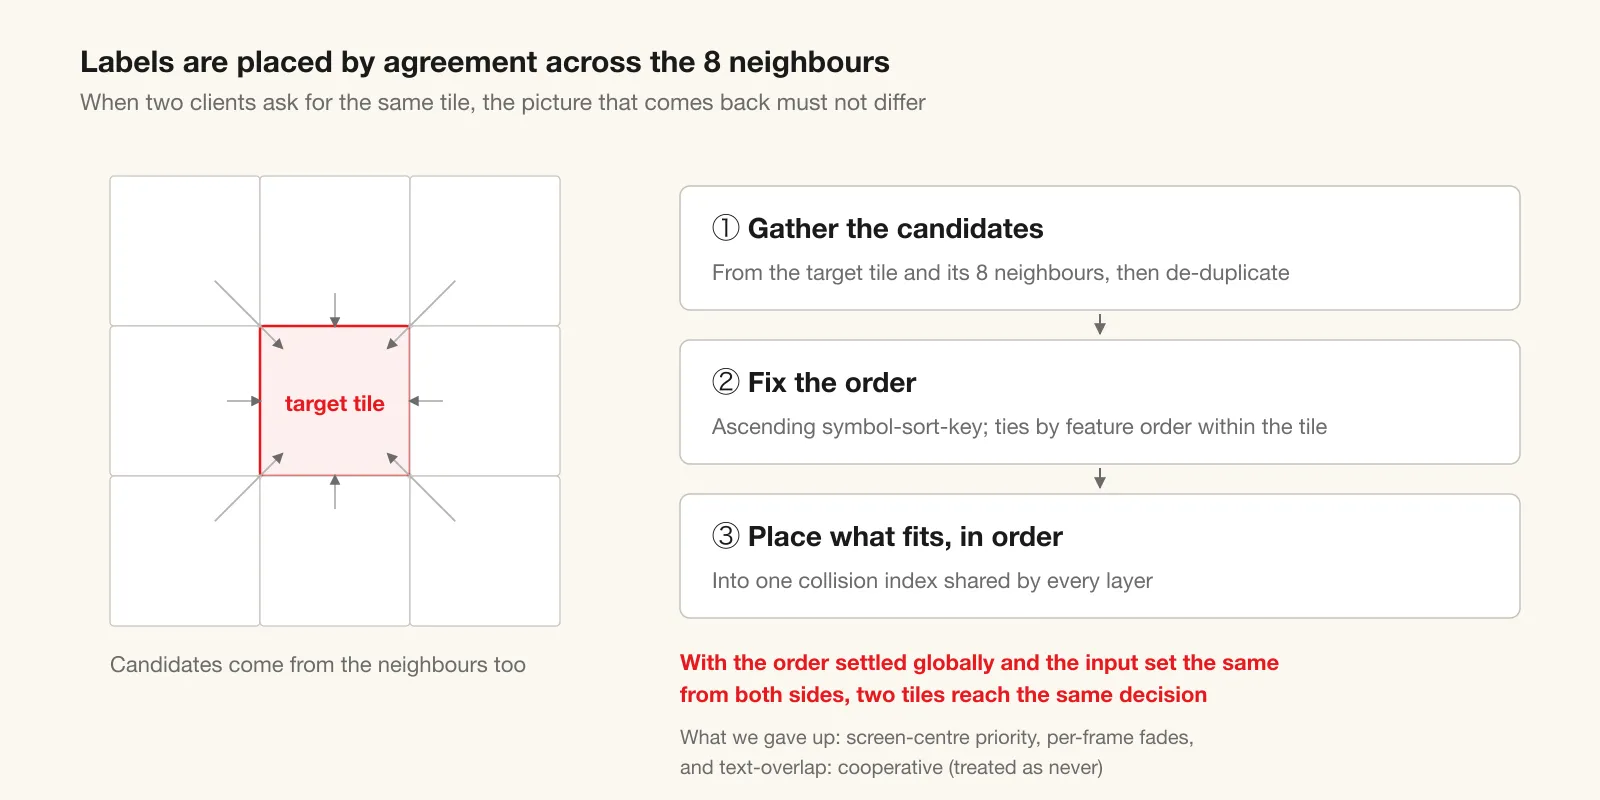
Since the order is settled globally and the input set is the same viewed from either side of a boundary, the two tiles reach the same decision. Whether a label is drawn or dropped is decided by agreement between both sides.
It is worth being honest about what we gave up in exchange. There is no mechanism that favours the centre of the current view. There are no per-frame fades. text-overlap: cooperative is treated as never. Anyone who wants dynamic label placement will find this thin in places, but we chose the trade in return for the same input always returning the same tile.
On Cloudflare Workers, once per request — the same frame as its siblings
At runtime, the ezu and hokusai described above run as WebAssembly (WASM) inside Cloudflare Workers. Papers is the third service built on the on-demand tile platform Re:Earth has been developing, and it shares its skeleton with the other two.
- Re:Earth Terrain — assembles terrain meshes (quantized mesh / Terrain-RGB / Terrarium) from Mapterhorn's digital elevation model at the CDN edge, close to the user, and returns them. See Terrain Tiles Without Pre-generation for the details.
- Re:Earth Buildings — takes Overture Maps building footprints (about 2.6 billion of them), bakes in ground elevation from Re:Earth Terrain, and assembles 3D Tiles on the spot.
- Re:Earth Papers — draws painted and plain basemaps with ezu and hokusai, once per request (this article).
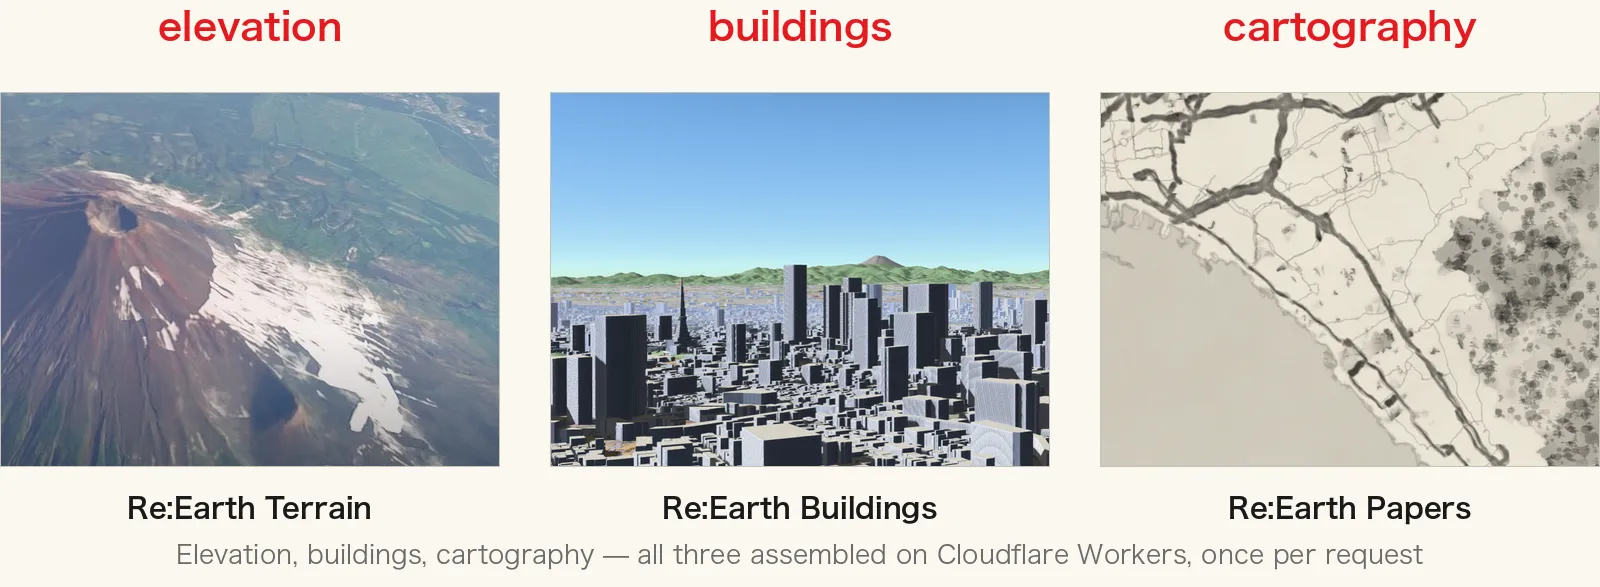
Line the three up and a path becomes visible: elevation, buildings, cartography — the three heavy ingredients of a map tile, moved into the request one after another. With Terrain and Buildings having finished moving the ground and the structures into the request, Papers put the drawing in the same place.
Three layers of cache
Drawing once per request obviously needs caching. Tiles are cached in the following three layers.
- The browser (
Cache-Control: immutable, max-age=1y) — the layer that ends on the user's device. - Cloudflare's edge cache (Cache API, per point of presence) — stored under a key that appends
?__v=to the request URL, and served from the PoP nearest the user. - Cloudflare R2 (the storage path is derived from version, data date, theme, language and z/x/y) — the bottom layer, holding one copy for the whole world. Even when a Workers runtime is torn down and recreated, or the request arrives at a different PoP, it can be restored from here.
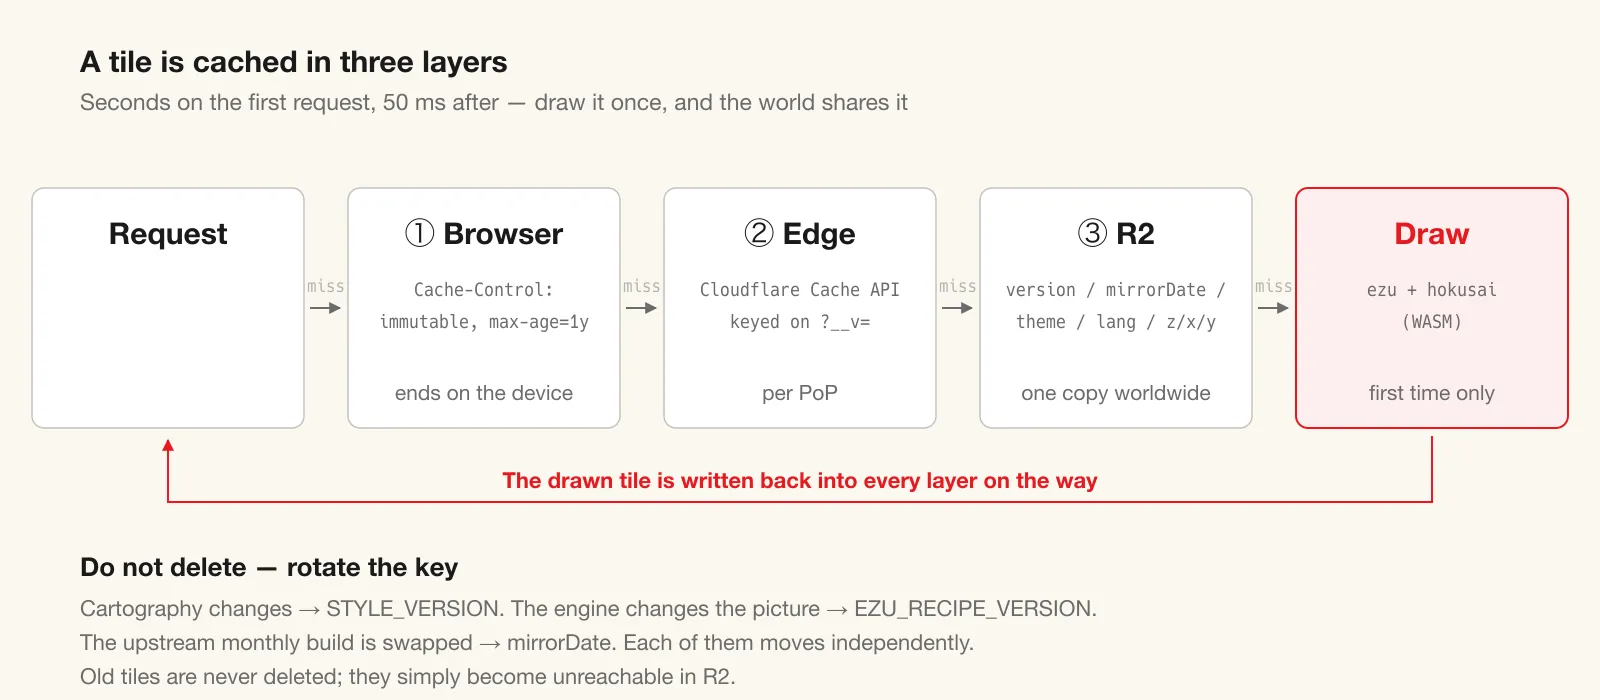
The key point is that we do not delete stored content; we change the version and switch to a new location. Cartography changes, and STYLE_VERSION moves. A renderer update changes the picture, and EZU_RECIPE_VERSION moves. The upstream monthly build is swapped, and mirrorDate moves. Each of them moves independently. Old tiles are never deleted; they simply remain in R2, unreachable.
Unknown query strings — a random cache-busting value such as ?cb=<random> — are ignored. The design avoids letting one tile with one picture acquire several URLs.
Measured — plain maps and painted maps are orders apart
These are measurements taken after we put the service into production: tiles at z14–15 chosen from the Tokyo metropolitan area, requested directly through papers.reearth.land.
First paint (a tile not yet in cache):
papers-light/papers-dark/protomaps-*— about 0.9–2.5 s (usually around a second in the body of the range)paint-pencil-sketch— about 2.0–2.7 spaint-voltage— about 3.2–7.0 spaint-pixel-art— about 4.5–7.3 spaint-sumi— about 8.8–13.9 spaint-wash— about 10.5–11.9 s
Already in the edge cache (a second request for a tile that has been drawn once):
- About 45–55 milliseconds, for every theme
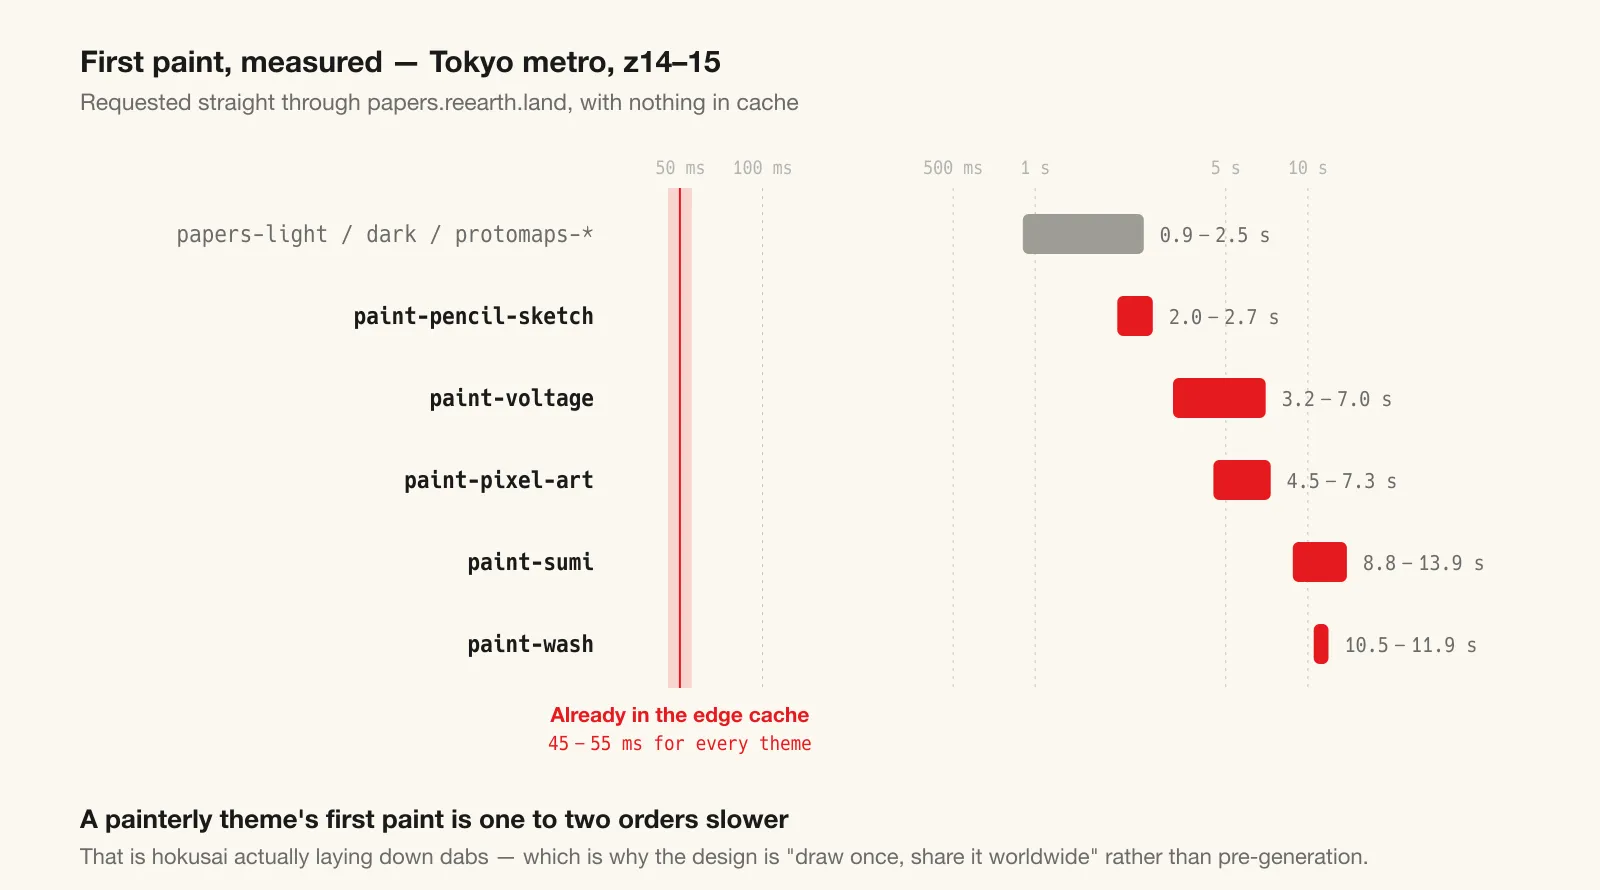
Lined up, the numbers make it plain that the first paint of a painterly theme is one to two orders of magnitude slower than a .png basemap. That is the time hokusai spends actually laying down dabs. The ezu documentation states it too: "Painterly styles cost more than translated basemaps."
The cache is designed around that performance profile. If the shape is "seconds on the first request, 50 milliseconds after", a world-wide cache in R2 pays for itself handsomely. Draw once, and the world shares it. Conversely, should painterly themes be pre-generated? The answer is no. There are several painterly styles, and regenerating every tile on Earth each time a theme changes would leave behind a great many tiles nobody ever asks for, wasting most of the cost.
Where the time goes
For reference, here is the breakdown measured by running ezu alone on a development machine (Apple M1). Drawing a 68-layer Protomaps theme at 512 px, the share of run time by kind of operation comes out as follows.
| Operation | Share of run time |
|---|---|
stroke (road casing, 123 nodes) | 69.5% |
stack (compositing) | 12.4% |
fill-solid | 9.8% |
text-labels • text-draw • label-placement | 5.2% |
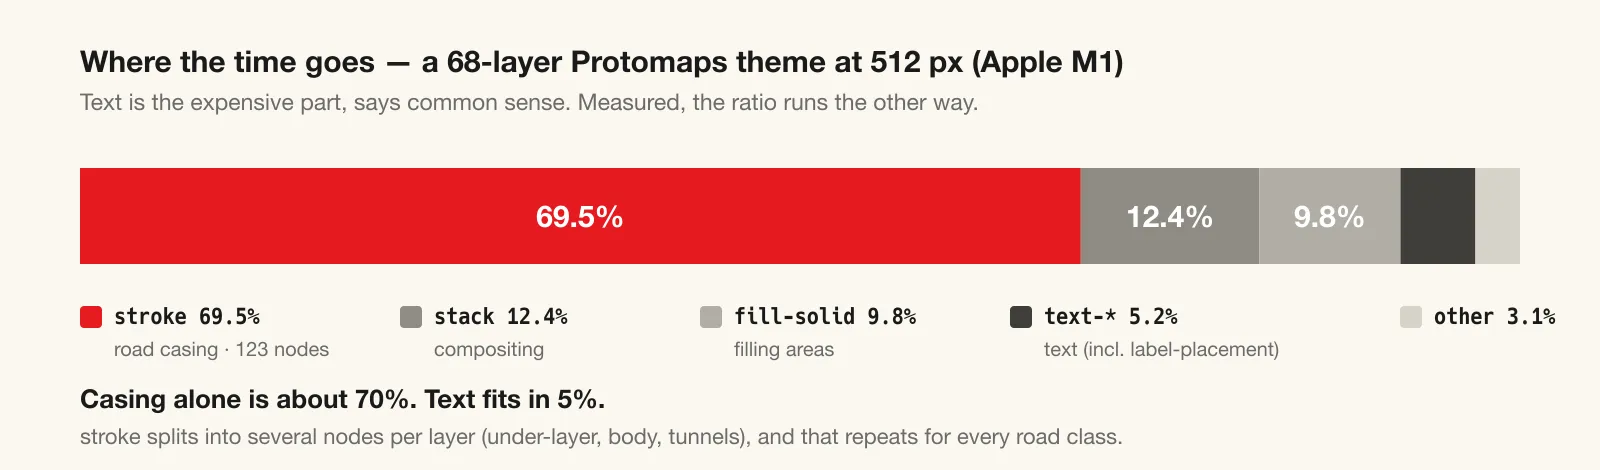
The surprise is that the ratio between text and road casing runs the opposite way from intuition. Received wisdom says text is the expensive part of map rendering; measured, road casing alone accounts for about 70%. The stroke calls for casing split into several nodes per layer — under-layer, body, tunnels — and that repeats for every class of road. Text stays around 5%, while casing will not come down without deliberate optimisation.
This is less a fact about ezu than about the MapLibre rendering model in general. For reference, ezu ships a parallel evaluator built on Rayon, Rust's parallelism library. For a watercolour style where six nodes can be processed concurrently, the documentation publishes measurements such as run time dropping from 6.3 seconds to 1.3.
The map became a painting again
Now that tiles have dropped the assumption of pre-generation, the map can become a painting again — at the moment you ask for it. Styles can be written as node graphs, the brush could be rebuilt as a libmypaint-compatible engine, and drawing happens inside the request. Redraw the same theme over the same ground whenever you like, and the same picture comes back.
Re:Earth Papers is an attempt to bring the hand that maps had in the era of painted provincial maps into the tile protocol. How you use it does not change — hand a TileJSON or a z/x/y URL to your usual map client. Please try the browser viewer at papers.reearth.land and look through the themes. We plan to keep adding themes.
References
- Service:
papers.reearth.land - Sibling services: Re:Earth Terrain / Re:Earth Buildings
- Repositories:
reearth/reearth-papers/reearth/ezu/reearth/hokusai/reearth/maplibre-expr-rs - Related posts: Terrain Tiles Without Pre-generation / Rendering Polygons along the Terrain using a Stencil Test / What is RTIN, which builds hierarchical LOD in real time?
- The foundation of the brush engine: libmypaint (the MyPaint / Krita project)
- Figure credits: map data © OpenStreetMap contributors (ODbL) · Overture Maps (buildings) · Protomaps · Mapterhorn · Sentinel-2 cloudless by EOX IT Services GmbH (CC BY 4.0, contains modified Copernicus Sentinel data 2020) · Stamen Watercolor (CC BY 4.0). The Blender geometry nodes screenshot is an image by Simon Thommes on Wikimedia Commons (CC BY 4.0, cropped). The Tenpo provincial map of Suō is held by the Yamaguchi Prefectural Archives and is in the public domain
- FOSS4G 2026 Hiroshima sponsor session, "Unlearning the Tile — terrain, buildings, and basemaps that are painted, none of it made in advance"
Eukaryaでは様々な職種で採用を行っています!OSSにコントリビュートしていただける皆様からの応募をお待ちしております!
Eukarya is hiring for various positions! We are looking forward to your application from everyone who can contribute to OSS!
Eukaryaは、Re:Earthと呼ばれるWebGISのSaaSの開発運営・研究開発を行っています。Web上で3Dを含むGIS(地図アプリの公開、データ管理、データ変換等)に関するあらゆる業務を完結できることを目指しています。ソースコードはほとんどOSSとしてGitHubで公開されています。
➔ Re:Earth / ➔ Eukarya / ➔ note / ➔ GitHub
Eukarya is developing and operating a WebGIS SaaS called Re:Earth. We aim to complete all GIS-related tasks including 3D (such as publishing map applications, data management, and data conversion) on the web. Most of the source code is published on GitHub as OSS.